Wynn Macau, Limited
WYNMF
Price:
$0.7
Market Cap:
$28.64B
Wynn Macau, Limited, together with its subsidiaries, develops, owns, and operates the Wynn Palace and Wynn Macau casino resorts in Macau. The company's Wynn Palace resort features approximately 424,000 square feet of casino space providing 24-hour gaming and various games comprising private gaming salons and sky casinos; a luxury hotel with a total of 1,706 guest rooms, suites, and villas; and 14 food and beverage outlets. Its Wynn Palace resort also consists of approximately 107,000 square feet of retail shopping; 37,000 square feet of meeting and convention space; recreation and leisure facilities consisting of a cable car ride, health club, spa, salon, and pool; and public entertainment a...[Read more]
Industry
Gambling, Resorts & Casinos
IPO Date
2010-01-05
Stock Exchange
PNK
Ticker
WYNMF
PE Ratio
[11.67]
ROE
[-16.99%]
Current Ratio
[1.11]
Dividend Yield
[2.74%]
Enterprise Value
[68.25B]
Dividend History
WYNMF Dividend History Overview
Dividends are a key part of long-term returns for investors, and Wynn Macau, Limited (WYNMF) has a track record worth reviewing. Looking at dividend history for WYNMF gives you an idea of how consistent the dividends have been and what you might expect in the future.
Ex-Dividend Date
2024-08-28
Dividend Yield
2.74%
Annual Dividend
$0.01
P/E Ratio
11.67
Payout Ratio
0.15
Dividend per Share
$0.15
EPS
0.06
| Ex-Date/EFF Date | Dividend Amount | Adjusted Dividend | Payment Date | Declaration Date |
|---|---|---|---|---|
| 2024-08-28 | $0.00961125 | $0.00961125 | 2024-09-12 | |
| 2024-06-03 | $0.009588 | $0.009588 | 2024-06-19 | |
| 2019-08-28 | $0.05735626 | $0.05735626 | 2019-09-16 | |
| 2019-06-04 | $0.45 | $0.45 | ||
| 2019-06-03 | $0.05743129 | $0.05743129 | 2019-06-19 | |
| 2018-09-18 | $0.09562058 | $0.09562058 | 2018-10-05 | |
| 2018-04-10 | $0.09554749 | $0.09554749 | 2018-04-25 | |
| 2017-08-31 | $0.02683209 | $0.02683209 | 2017-09-15 | |
| 2017-06-05 | $0.05389936 | $0.05389936 | 2017-06-20 | |
| 2016-06-08 | $0.03 | $0.03 | ||
| 2016-04-13 | $0.077 | $0.077 |
Wynn Macau, Limited (WYNMF) Dividend History Chart
The table below shows Wynn Macau, Limited (WYNMF) dividend history over the years, including the amount per share, the payout date, and any adjustments for stock splits.
Wynn Macau, Limited (WYNMF) Dividend Growth
Wynn Macau, Limited (WYNMF) dividend history also allows you to track its dividend growth over time. This gives you insight into how the company’s earnings and payout ratios have evolved. Tracking this growth can help you gauge the stock's potential for future income.
Other Popular Dividend Stocks
Check out the dividend history of other popular stocks:
| Stock name | Dividend yield |
|---|---|
| Banyan Tree Holdings Limited (BYNEF) | 0.03% |
| MGM China Holdings Limited (MCHVF) | 0.07% |
| Table Trac, Inc. (TBTC) | 0.01% |
| SkyCity Entertainment Group Limited (SKYZF) | 0.04% |
| MGM China Holdings Limited (MCHVY) | 0.07% |
Track & Identify Dividend Stocks
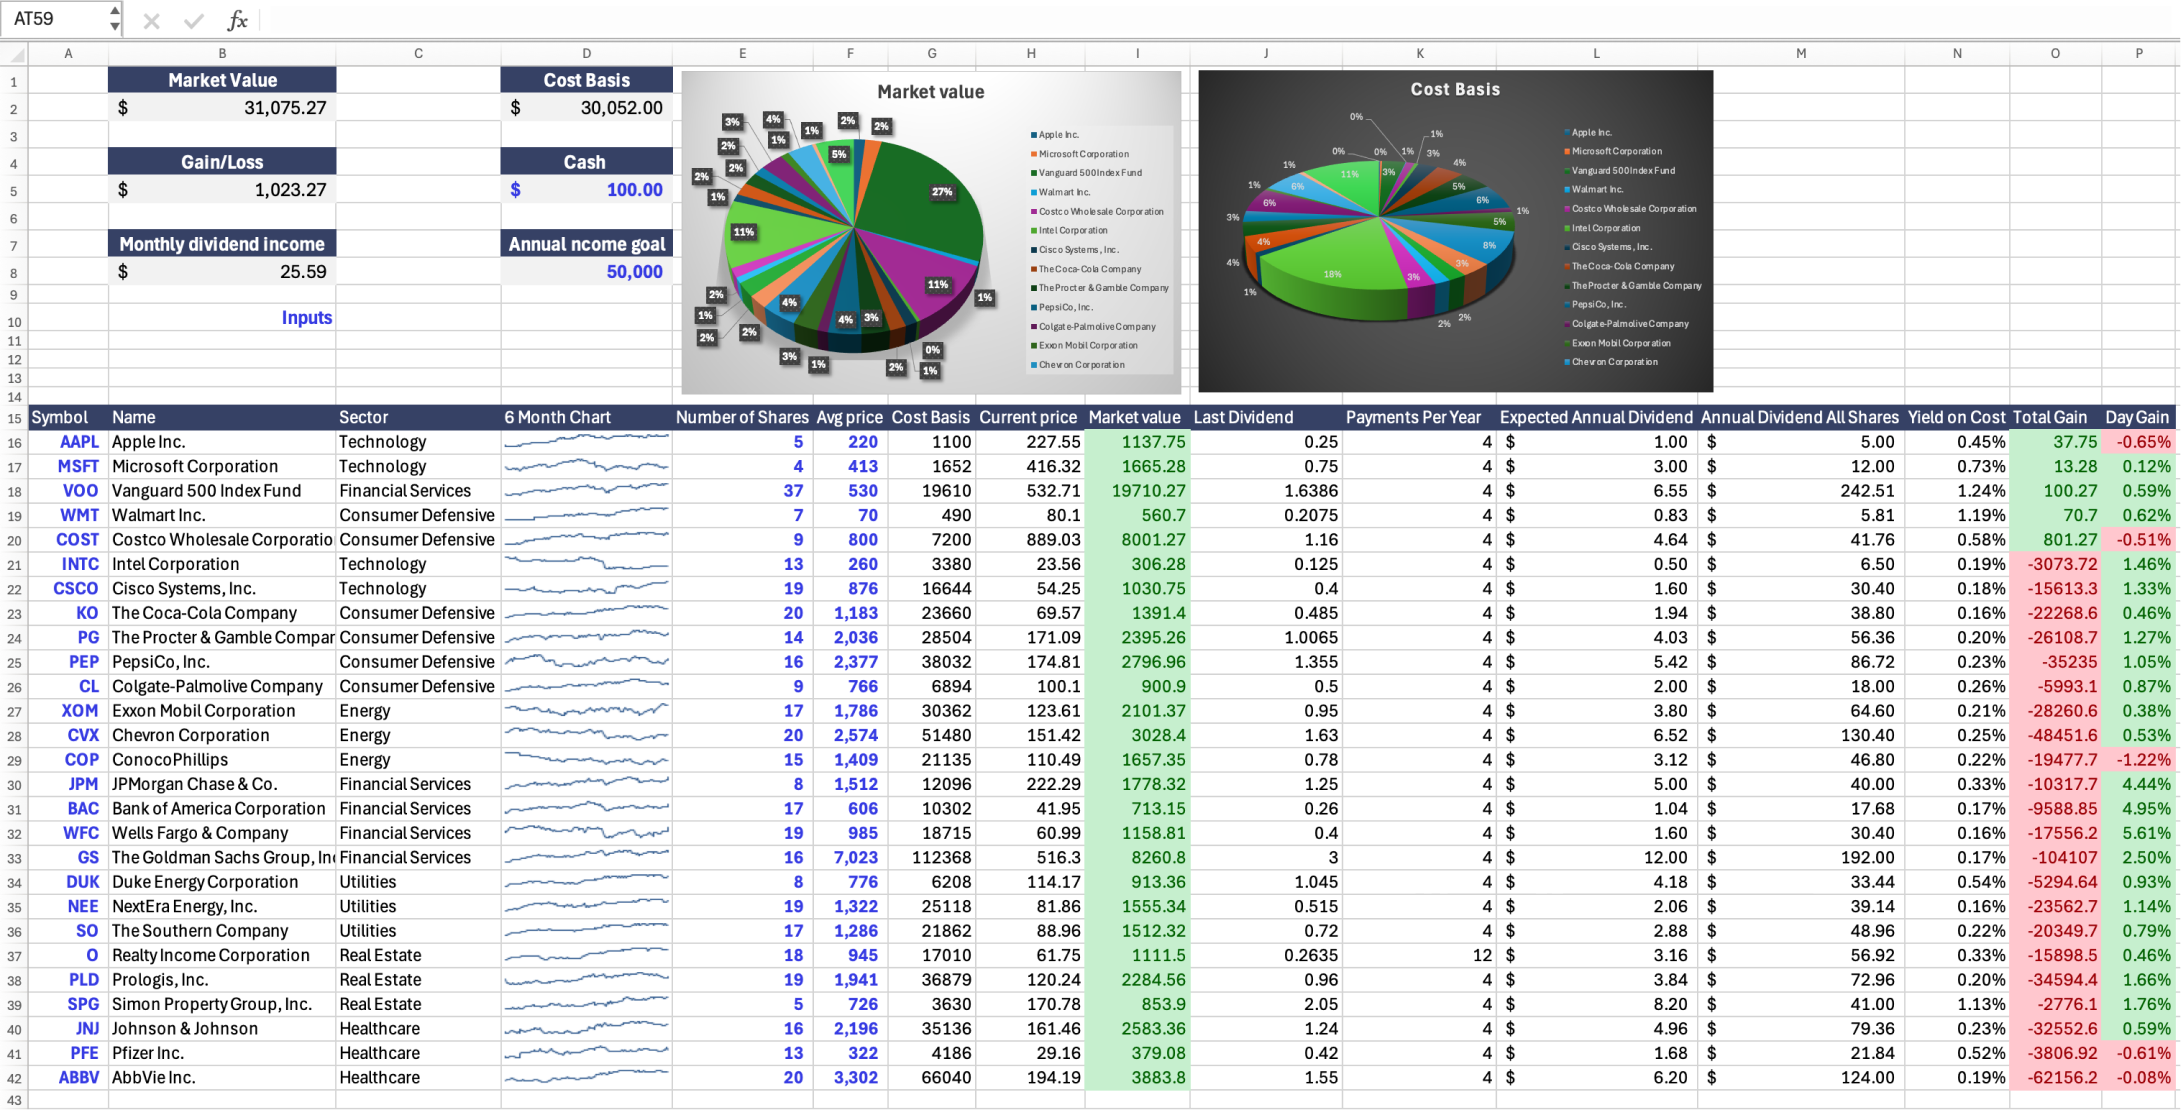
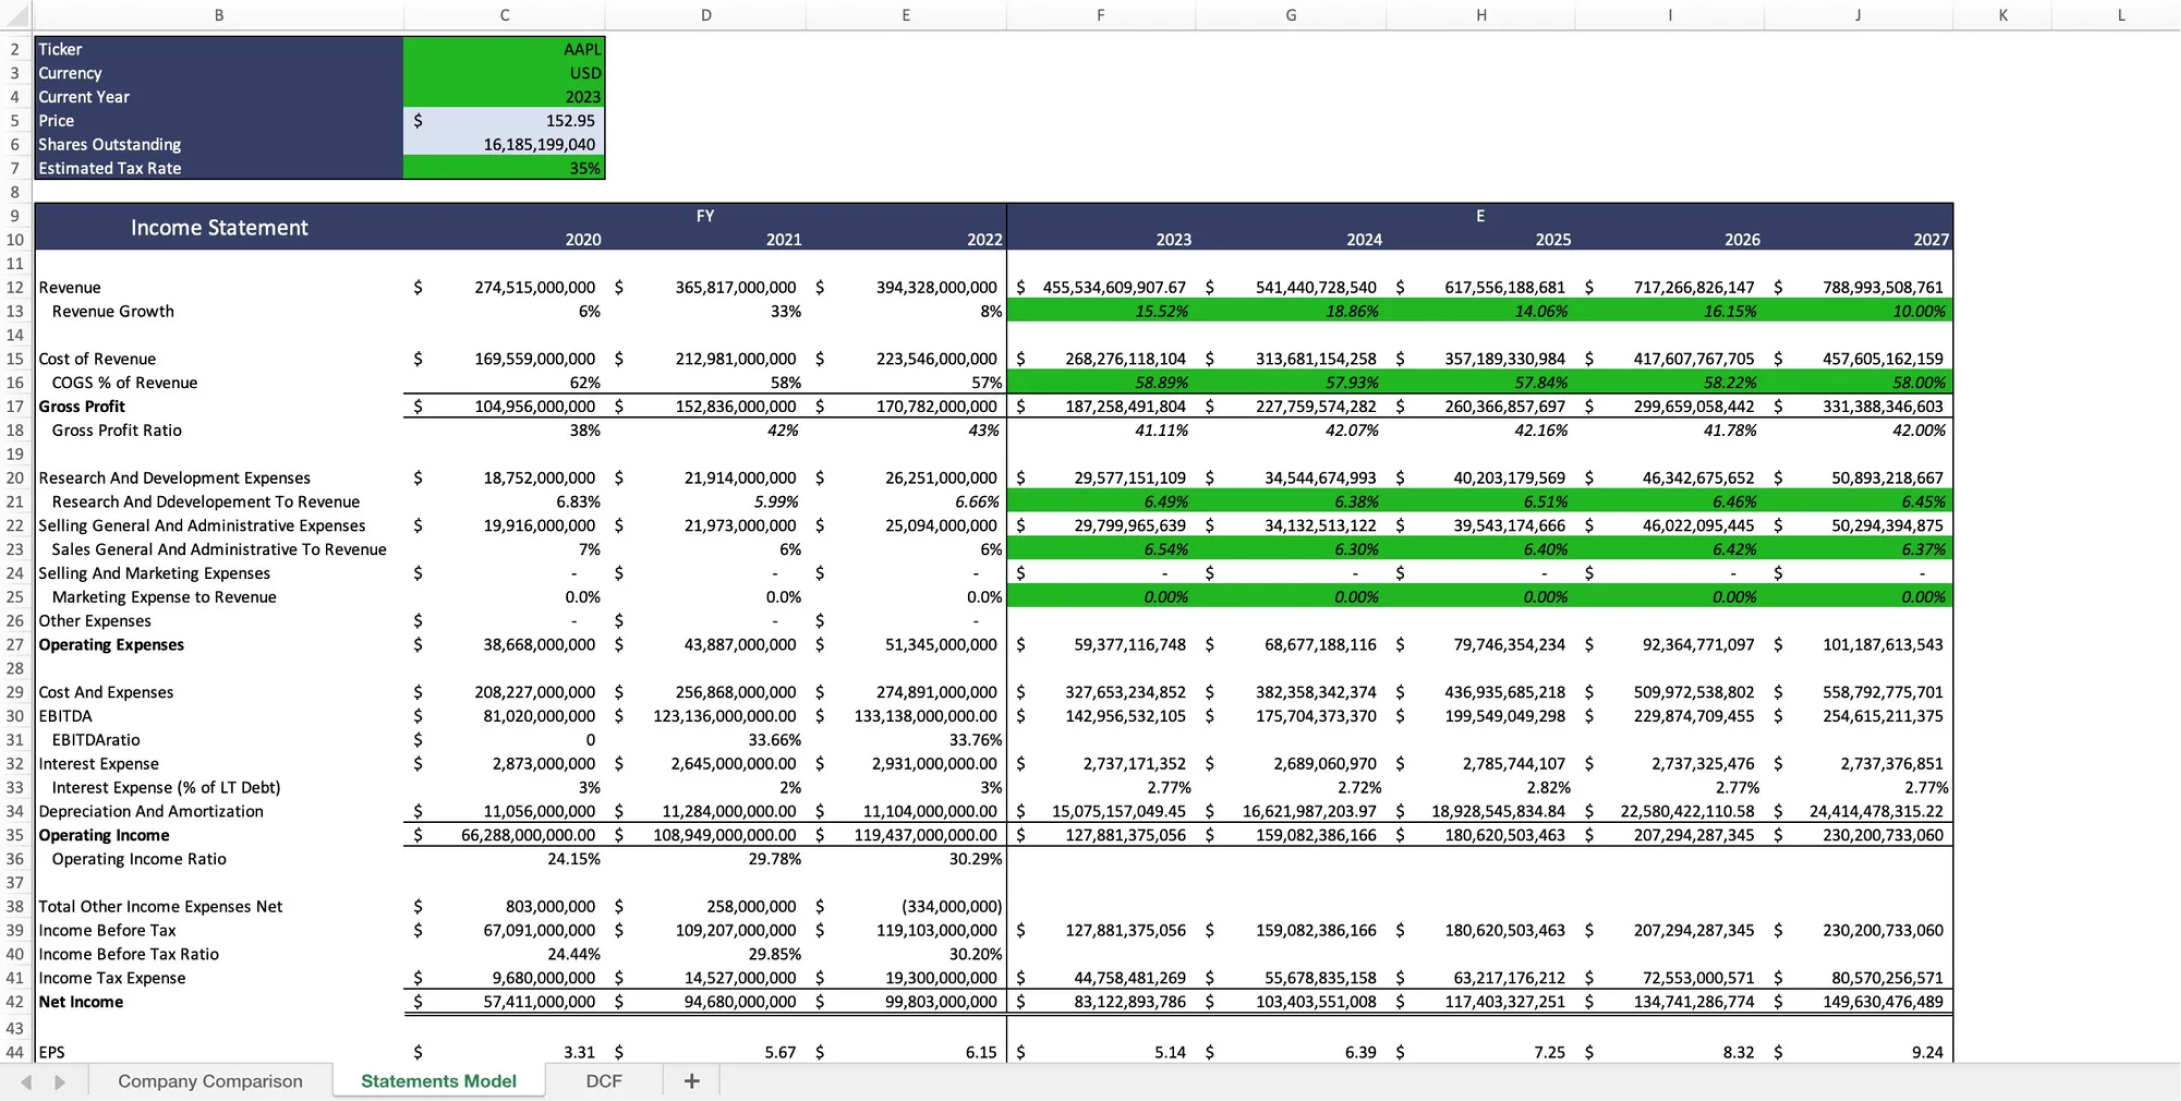
Tracking and finding valuable dividend stocks to invest in is difficult. For this, you can use Wisesheets, which allows you to pull all necessary dividend, financial, and price data to track your dividend investments in one place exactly how you want, using the power of spreadsheets.
You can build any custom analysis dashboards, screeners and trackers with no code and analyze companies like Wynn Macau, Limited (WYNMF) without the pain and hassle of copy pasting data.
Frequently asked questions❓
What is dividend history?
How do I check past dividend history?
What does the ex-dividend date mean?
What is WYNMF’s dividend yield?
What is the difference between regular and special dividends?
Has WYNMF increased its dividends over time?
Why might dividend history data be delayed?
How often does WYNMF pay dividends?
What factors impact WYNMF's dividend payments?
Can dividends change over time?
What is WYNMF’s next dividend date?

