Welcome to the Wisesheets Docs!
Wisesheets is the ultimate Excel and Google Sheets add-on for investors. Wisesheets was built with one goal, to allow anyone to quickly find good investment opportunities. Our add-on has many different features and data available such as financials, key metrics, dividend data, live price data, crypto data, commodities and more. We have built these docs to help you get the most value out of Wisesheets.
😎 Tips
Important Information
Installation
Excel
Installing Wisesheets on Excel is very simple. All you need to do is follow these steps:
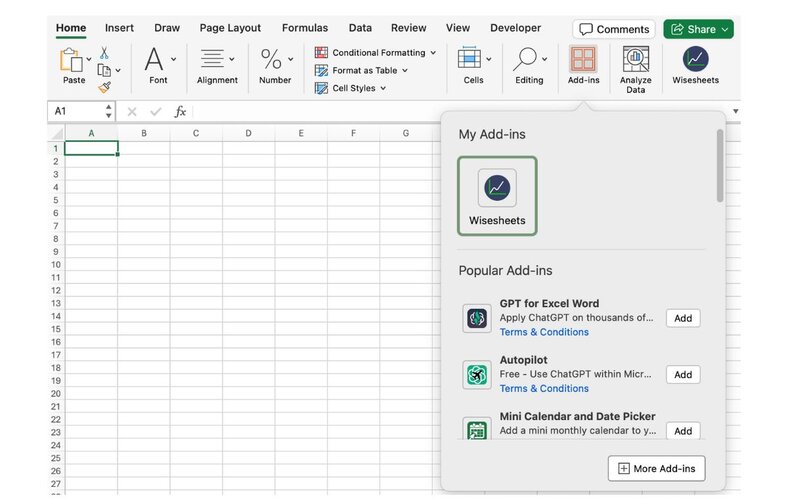

Now you will be able to access the add-in at any time under the Home tab as shown below:

Google Sheets
Installing Wisesheets on Google Sheets is very simple. All you need to do is follow these steps:

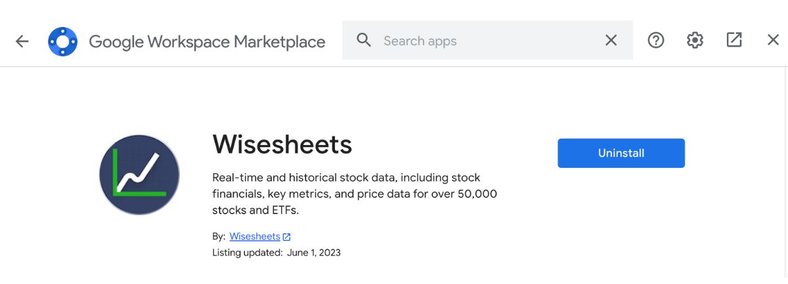
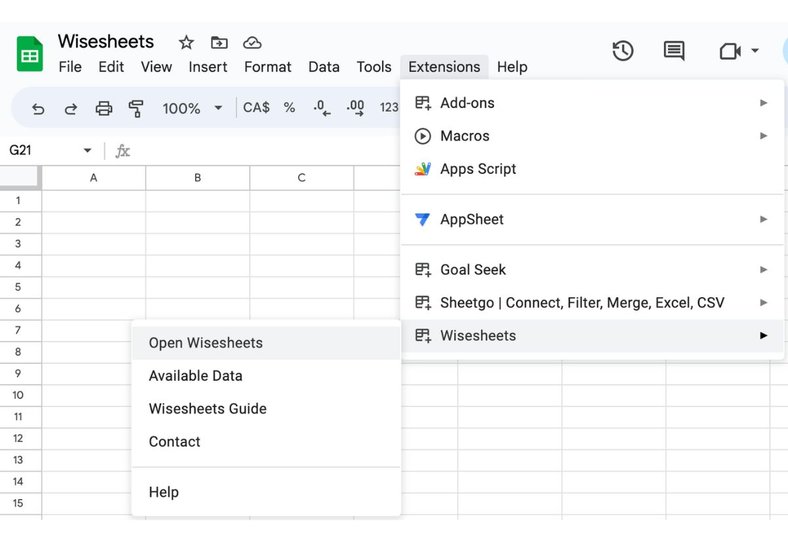
Now you will be able to access the add-on at any time under the extensions menu as shown below:
Support
If you have any feedback or come across any issues, feel free to reach out to us by email at info@wisesheets.io or on our discord channel.
Statement Dump
If you are looking to get an overview of a company's financials, one of the best ways to do this is to use statement dump. In a few clicks, you can get the income statement, balance sheet, cash flow statement, key metrics, and growth metrics annually or quarterly right on your spreadsheet. You will get either the last 19 years of data or 72 quarters, depending on your preference.
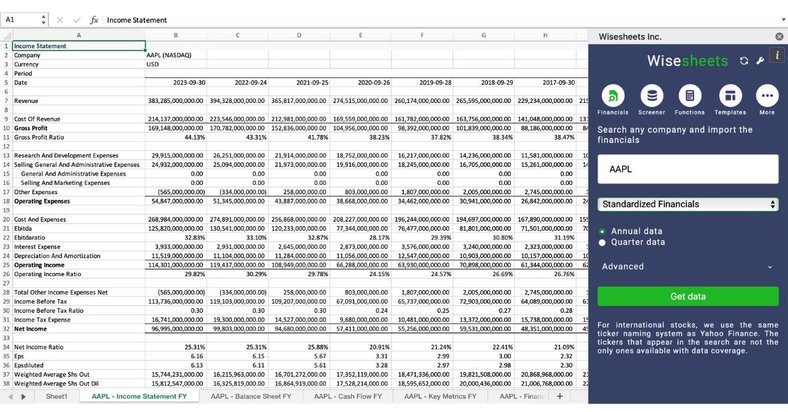
By default, the order of the data will be sorted from most recent data to oldest. However, with a pro account, you can click on the advanced option to reverse the order of the statements.
Better yet, you can access the financial statements exactly as they were reported to the SEC. Simply select SEC as reported financials and select whether you want annual or quarterly data.
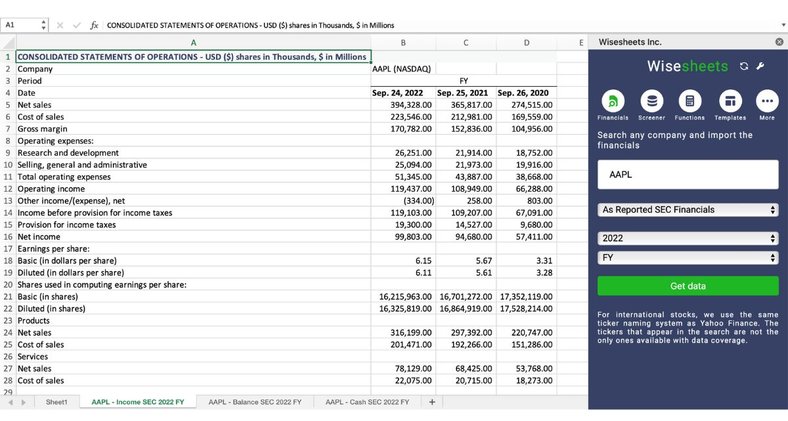
Note: this only applies to companies that report to the SEC (Securities Exchange Commission).
😎 Tips
WISE Function
This function is best used for obtaining financials, key metrics, revenue segments, analyst estimates, etc. (see data available per function).
The WISE function syntax is =WISE("ticker/s", "parameter/s", "period/s", ["quarter"], [divisor])
Here are a few examples of valid function calls: =WISE("AAPL","ROE","TTM") =WISE("TSLA", "Revenue", "LY",,1000000) =WISE("AAPL","Free Cash Flow",2019,"Q3")
😎 Tips
Large Data Requests
Instead of making many function requests at once, you can get data faster by using ranges in the functions.
All you need to do is enter a range of tickers instead of a singular ticker, enter a range of parameters instead of a single parameter or enter a range of periods instead of a single period. You can see how it works in this example:
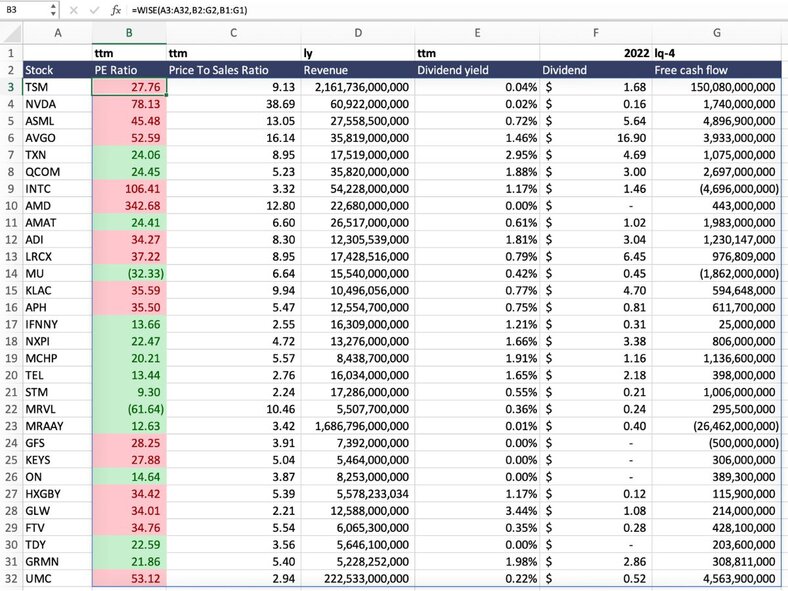
As you can see, the function is getting all these key metrics for multiple companies across the different periods in a single function call. This saves you a lot of time and makes your spreadsheet faster.
WISEPRICE Function
This function is best used for obtaining live price data, historical price data, dividend payment information, etc (see data available per function).
The WISEPRICE function syntax is =WISEPRICE("ticker/s", "parameter/s", number of days to end, "start date", "end date")
Here are a few examples of valid function calls: =WISEPRICE("TSLA","Price") =WISEPRICE("AAPL", "Close",,"01/01/2022", "01/30/2022") =WISEPRICE("AMZN", "Open", 2)
😎 Tips
Large Data Requests
Instead of making many function requests at once, you can get data faster by using ranges in the functions.
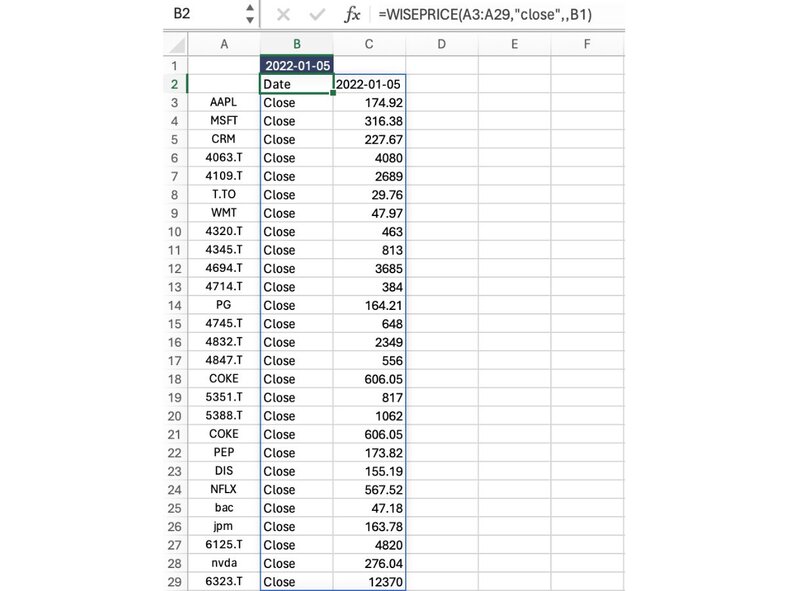
All you need to do is enter a range of tickers instead of a singular ticker or enter a range of parameters instead of a single parameter. You can see how that works in this example:
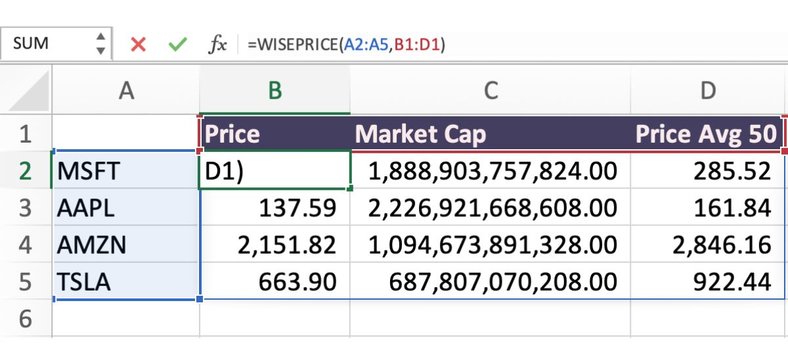
As you can see, the function is getting all these real-time values for many different companies in a single function call. This saves you a lot of time and makes your spreadsheet faster.
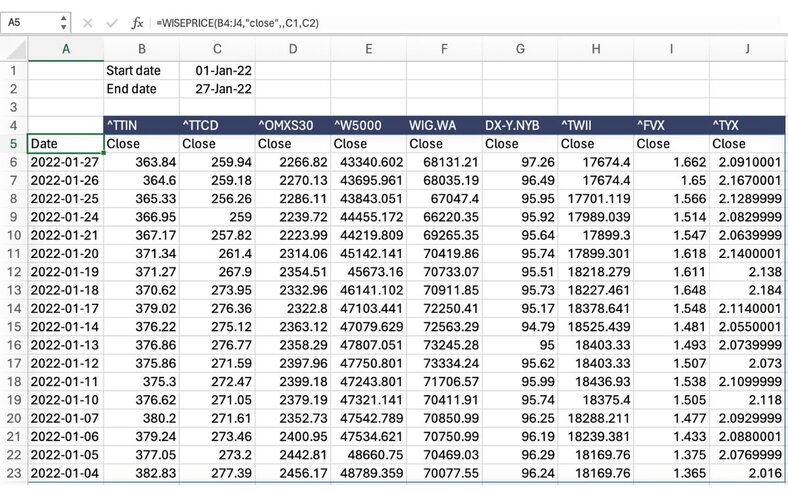
You can also enter multiple tickers in the function to get historical price data for many securities at once.
WISEFUNDS Function
This function is best used for obtaining ETF and fund data like expense ratio, net asset value, assets under management, etc. (see data available per function).
The WISEFUNDS function syntax is =WISEFUNDS("ticker/s", "parameter/s")
Here are a few examples of valid function calls: =WISEFUNDS("SPY","Expense Ratio") =WISEFUNDS("PICK","Nav")
😎 Tips
Large Data Requests
Instead of making many function data requests at once, you can get data faster by using ranges in the functions.
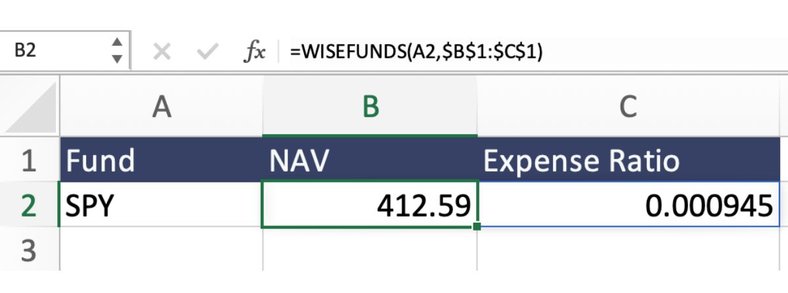
All you need to do is enter a range of parameters and/or tickers instead of a single parameter. You can see how that works in this example:

As you can see, the function is getting all these real-time parameters for many different funds in a single function call. This saves you a lot of time and makes your spreadsheet faster.
WISEOPTIONS Function
This function is best used for obtaining real-time and historical option data like strike price, expiration date, greeks, etc. (see data available per function).
The WISEOPTIONS function syntax is =WISEOPTIONS("ticker/contractID", "type", "parameter/s", ["date"]})
Here are a few examples of valid function calls: =WISEOPTIONS("AAPL","Put", "Strike") =WISEOPTIONS("AAPL","Call", "Strike", "2025-01-16") =WISEOPTIONS("AAPL250117P00005000", "Put", "Theta", "2025-01-16")
😎 Tips
Large Data Requests
Instead of making many function data requests at once, you can get data faster by using ranges in the functions.
All you need to do is enter a range of parameters instead of a single parameter. You can see how that works in this example:
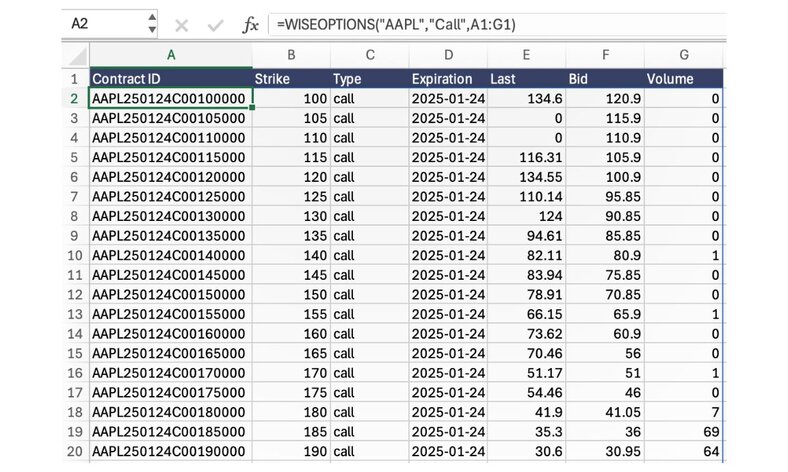
As you can see, the function is getting all these historical parameters for a stock in a single function call. This saves you a lot of time and makes your spreadsheet faster.
Wisesheets Templates
Wisesheets makes it easy for you to get started with your analysis faster by providing pre-made templates built by us and our community. You can download and modify the templates in any way you'd like. Templates include:
To download a template navigate to the Wise templates menu.
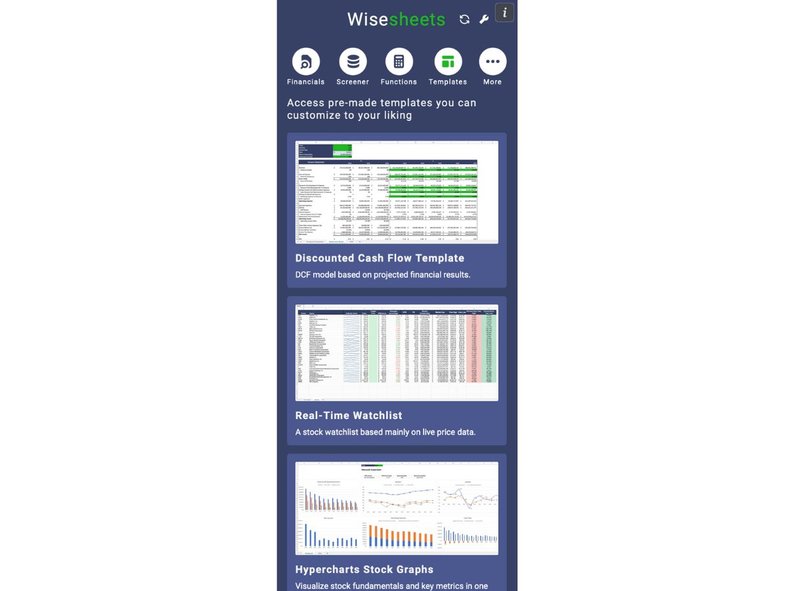
From here, you can browse the selection of templates and download any of them right away. Note that templates in Excel and Google Sheets may be different or only available on one platform.
Portfolio Connect
Instead of copy-pasting or downloading your broker holdings and transactions into your spreadsheet, you can connect directly to over 30 major brokers and always keep your holdings and transactions up to date. If you use more than one broker, you can connect them all and see your consolidated transaction history and holdings in one place.
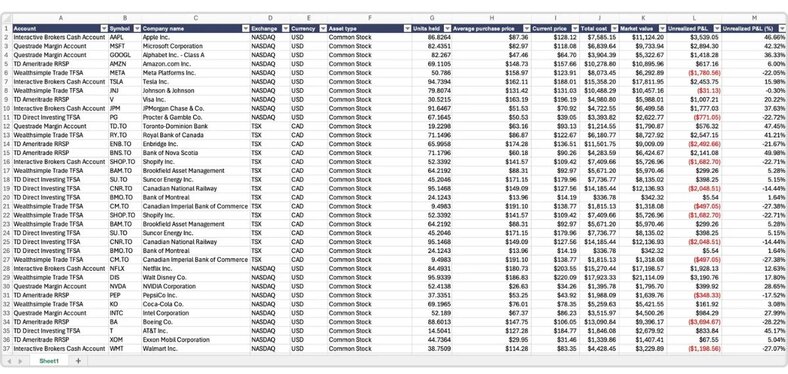
Simply click on the portfolio icon at the top left of the add-on or click here and select Manage Broker Connections. After connecting, return to the add-on, click the portfolio icon again, and you’ll be able to view your current holdings or transaction history.
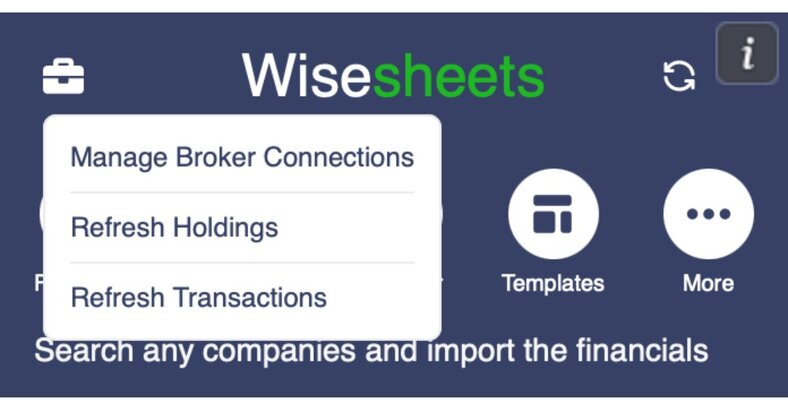
After connecting, return to the add-on, click the portfolio icon, and you’ll be able to view your current holdings or transaction history.
😎 Tips
Downloading Templates
In Excel, after you click on the template you would like to download, the template file will be downloaded and available in your downloads folder.
On Google Sheets, you will get a duplicate file of the template, which you can then edit in any way you'd like.
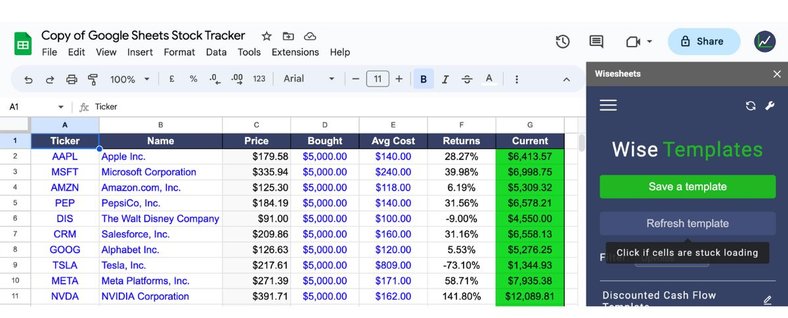
Note that when you first open a template, you need to have the add-on side panel open, and you may need to change the company ticker or press the refresh template button (the blue button) to get the data and stop the cells from getting stuck loading.
Refresh Data
At any time you can use the refresh data button at the top right of the add-on to refresh live data you may have on your spreadsheet. This includes:
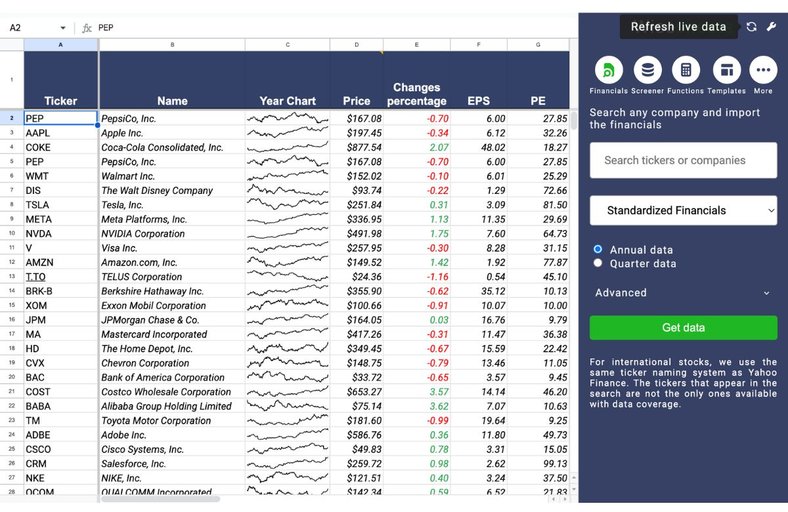
Refresh Errors
Occasionally when requesting large amounts of data at once, you may get an #error on Google Sheets or "too many simultaneous requests" in Excel. Instead of manually having to go to each cell that contains this and fix this, you can press the refresh errors button at the top right of the add-on (wrench icon).
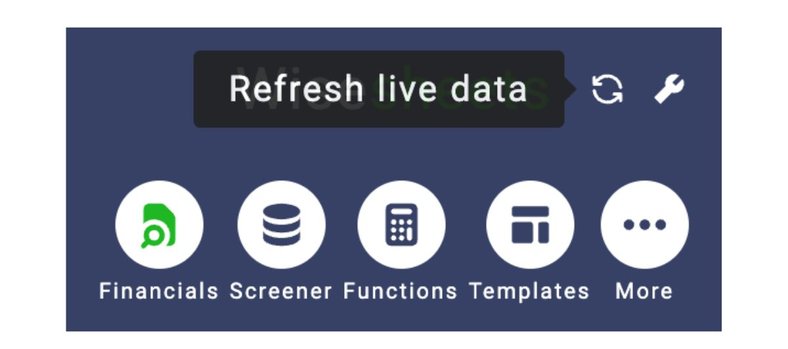
This will fix them all at once.
Trending Stocks
You can now track trending and popular stocks right from the main panel. It’s designed to make keeping up with the markets faster and easier.
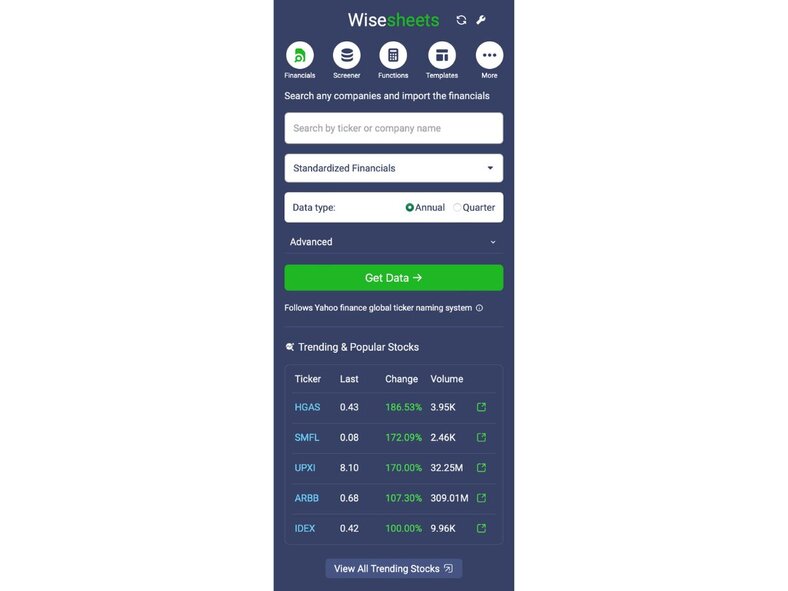
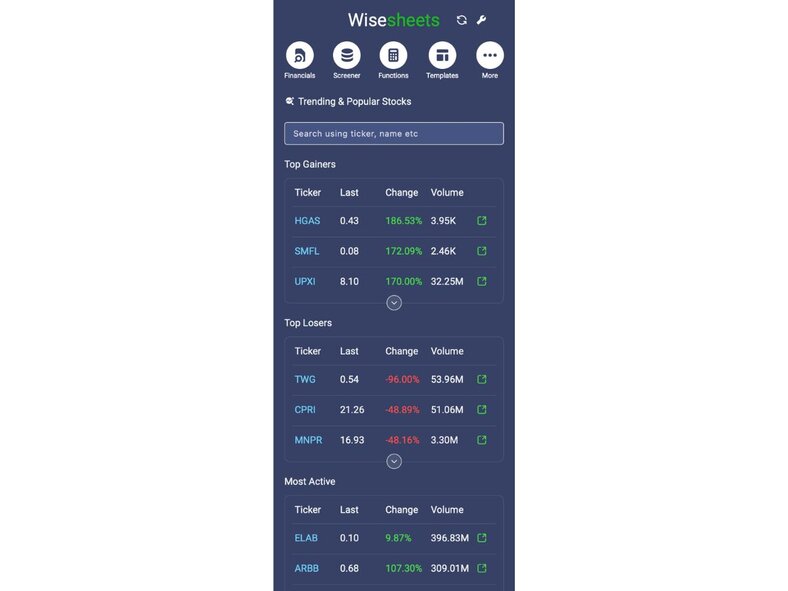
Top Gainers: Discover which stocks are soaring. Top Losers: See which stocks have taken a hit. Most Active: Find the stocks with the highest trading volume. Clicking the dropdown arrow in a specific category will reveal more stocks within that list, whether it’s gainers, losers, or the most active.
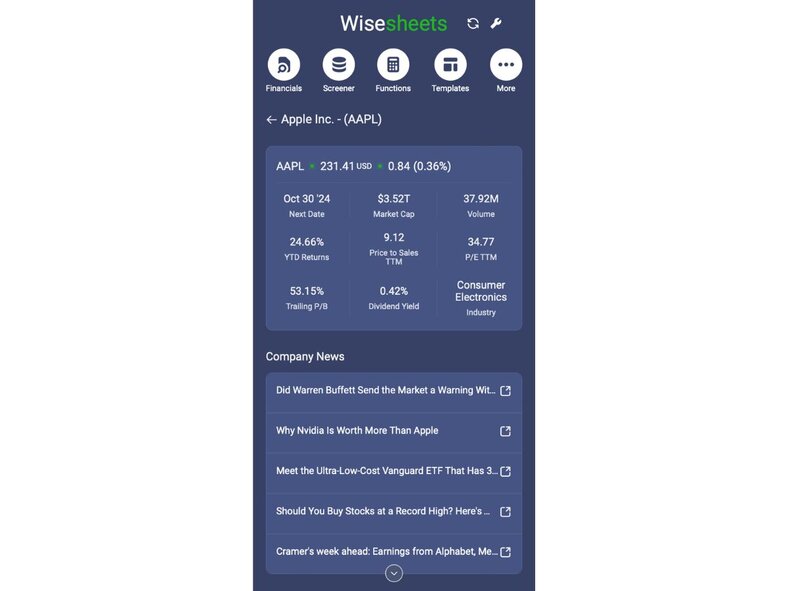
Click on any stock ticker to see the important stuff, like: Price, market cap, and volume, all updated live. Performance metrics like YTD returns and P/E ratios. Company news headlines to help you stay in the loop. For U.S. companies, you can even access official filings for more in-depth analysis.
Function Builder
Instead of figuring out which function to use for each data point you want to access, you can use the function builder to generate it for you.
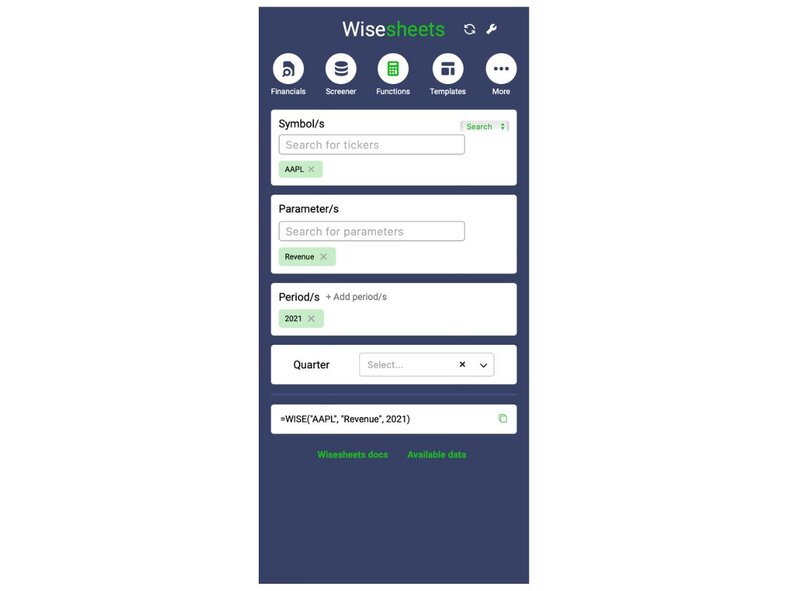
Here’s a breakdown of how it works: Symbols: Begin by entering the ticker symbol(s) of the company or companies you want to analyze. This can be a single ticker like "AAPL" or a list if you’re analyzing multiple stocks simultaneously. Note: You can also change from search to select a range of tickers, for example A2:A5. Parameters (if applicable): Choose the financial metric or data parameter you need. Options include metrics like "Revenue," "Net Income," and others from the company’s financials. This flexibility allows you to build custom reports by specifying exactly which data points to pull. Note: Certain parameters cannot be selected at the same time with others. If that's the case, they will appear grayed out. Periods (if applicable): Select the period, such as the year or quarter, for which you need the data. For example, entering "2021" will fetch the annual data for that year. Specific dates (if applicable): Enter the exact start and end dates to define the timeframe for your data request. For instance, setting "2024-10-31" as both the start and end date will fetch data for that particular day only. This option is perfect for obtaining precise daily metrics, and you can choose to include a date column in the results to ensure your data is well-documented. Alternatively, you can specify a broader range to capture historical trends within your selected period. Note: Alternatively, use the "Number of days" feature to retrieve data over a recent period, such as the last 10 days. Simply select this option and specify the number of days, and Wisesheets will automatically pull the data from the past 10 business days up to the current date. This is useful for quick analysis of short-term trends without needing to manually enter date ranges. Quarter Selection (if applicable): For quarterly data, you can specify the particular quarter to narrow down the timeframe, allowing for targeted analysis within the fiscal year. Generated Formula: Once you’ve made your selections, Wisesheets automatically generates the appropriate formula. For instance, entering "AAPL" as the symbol, "Revenue" as the parameter, and "2021" as the period results in the formula =WISE("AAPL", "Revenue", 2021), which you can copy directly.
Analyzing Stock Financials
There are 2 ways to analyze stock financials. The first is to use the statement dump function to get them all at once annually or quarterly in our standardized format or as reported to the SEC:

The second is to use the function to get only the financial data you care about. For this use case, we recommend selecting the financial data you'd like from our available data and then building a spreadsheet model like this:
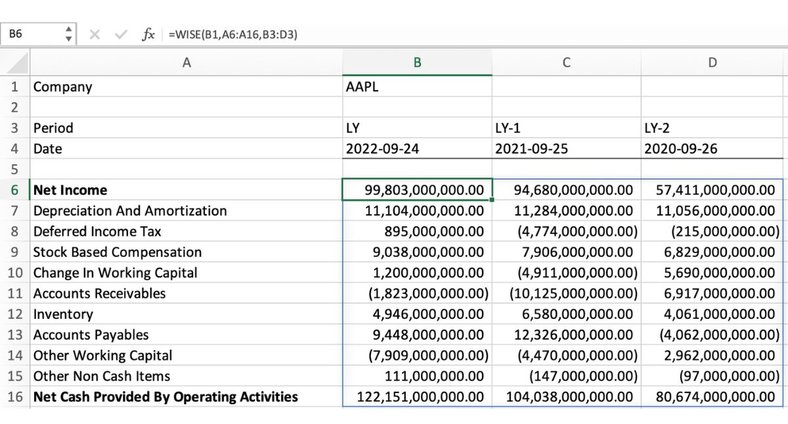
As you can see, in one function call you can get the all the financial data you need. You can substitute the LY, LY-1, etc, for specific years or you can also use LQ, LQ-1 etc. to get the data for many quarters.
😎 Tips
Analyzing Live Price Data
It is easy to analyze real-time price data for stocks, ETF funds, and more with Wisesheets. A typical use case involves gathering a list of stocks from your portfolio or watchlist and gathering all the real-time metrics you are interested in (see available data).
To get real-time data you need to use the WISEPRICE function. Here is an image showing how to use it to get real-time data.
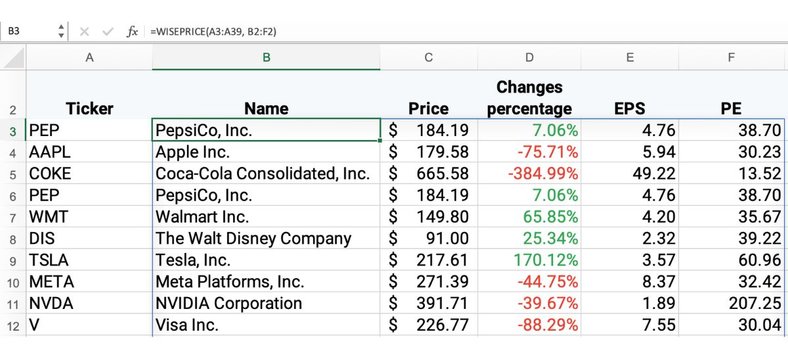
Assuming you are looking to get real-time data for multiple securities, this is the best way to do it. You will get data faster, and you can refresh it anytime you'd like by pressing the refresh data button at the top right of the add-on.
😎 Tips
Historical Price Data Analysis
There are 2 main ways of getting historical price data for stocks, ETFs, and other securities covered. The first is for individual assets.
For example, to get the last 30 days of close and open price for Apple, you can do the following: =WISEPRICE("AAPL", "Close", 30)
You can also enter a specific date to get data in the function. For example =WISEPRICE("AMZN", "close", , "01/01/2019", "01/10/2019")
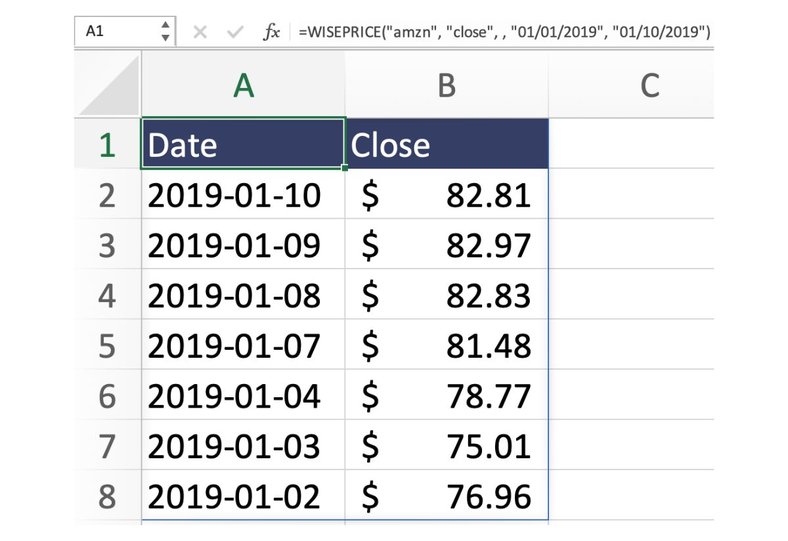
For multiple stocks, you can enter multiple tickers in the function as shown in the images below:


😎 Tips
Historical Dividend Payment History
With the =WISEPRICE function, you can get all of the dividend data in a single function call. All you have to do is enter =WISEPRICE("AAPL", "dividend")

This provides you with the ex-date, dividend, adjusted dividend, payment date, and declaration date.
You can also enter a specific date to get data in the function. For example =WISEPRICE("aapl", "dividend", , "01/01/2017", "01/01/2022")
😎 Tips
Annual Dividend Payments
Getting the annual dividend payment for a particular stock or ETF is simple. Using the WISE function, you can get the data like this: =WISE("AAPL", "Dividend", 2022)
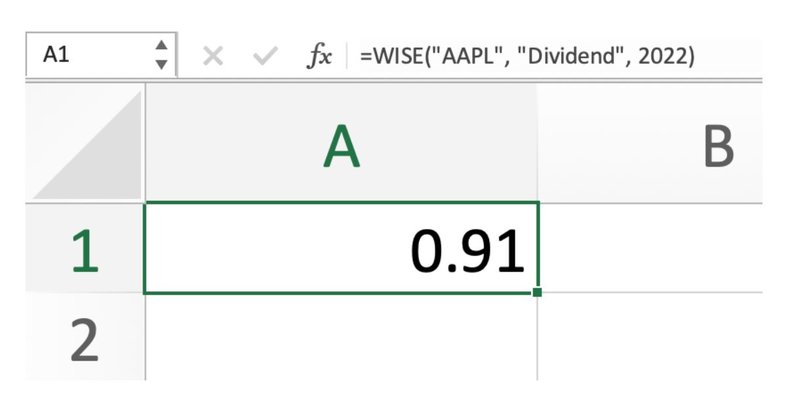
This will provide you with the SUM of all the dividend payments made during that year.
If you'd like to get the adjusted dividend amount, you can do this like this: =WISE("AAPL", "Adjusted Dividend", 2022)
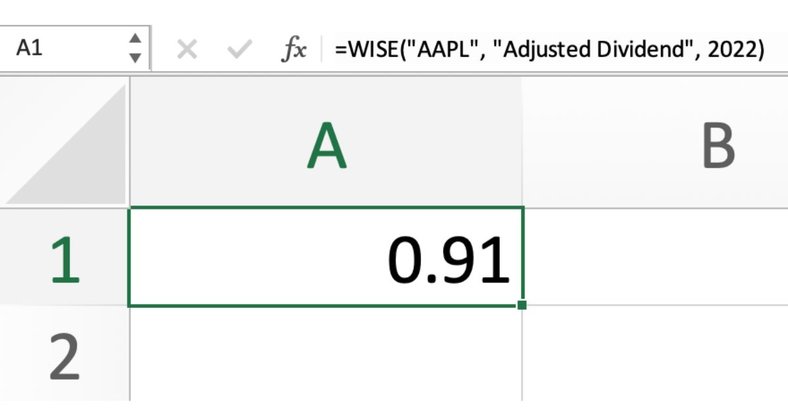
You can also get this number for multiple years at once:
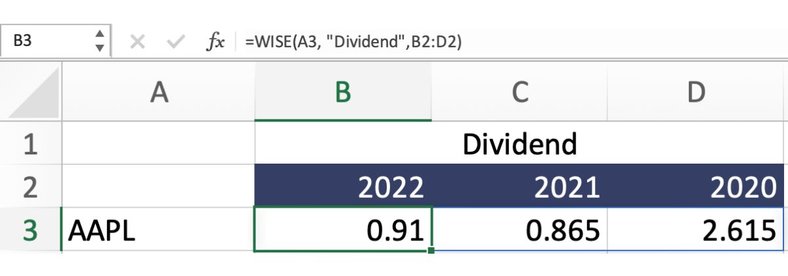
Quarterly Dividend Payments
Using the WISE function, it is simple to get past stock and ETF dividend payments. You can get individual quarterly dividend payments as follows: =WISE("AAPL", "dividend", "LQ")
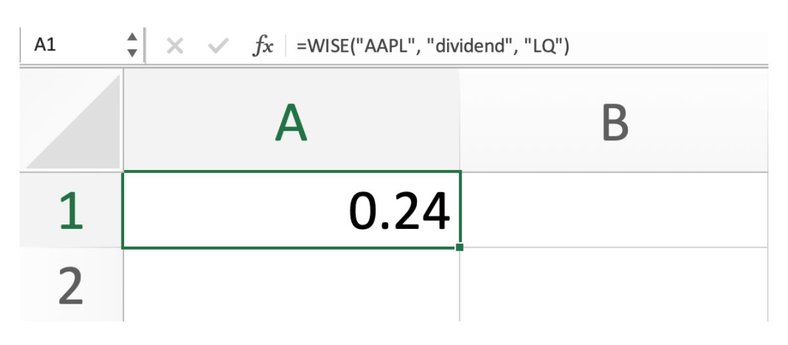
This will return the latest dividend paid by a stock or ETF. The same applies to the adjusted dividend.
😎 Tips
Segment & Geographic Revenues
You can get a specific company’s revenue breakdown across key business segments and geographic markets. Using the WISE function, you can get this data on a quarterly and annual basis. To get segment revenue breakdowns, all you have to do is use the function as follows: =WISE("AAPL", "segment revenues", 2020)
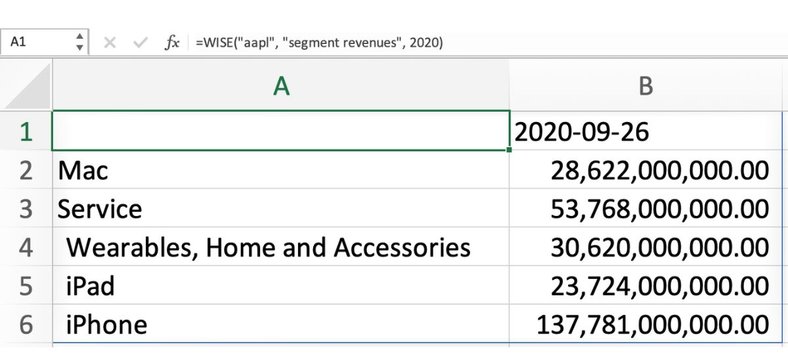
You can also substitute the specific year for “LY”, “LY-1”, “LY-2”, etc, which provides you with the latest fiscal year data or the previous fiscal years.
The same concept applies to geographic revenues. =WISE("AAPL", "geographic revenues", "LQ-2")
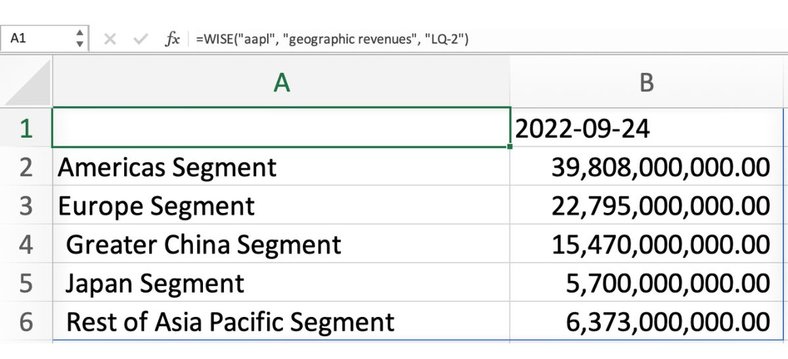
Due to some technical constraints for quarterly data, you can only use the LQ, LQ-1 period system. *This feature is only for companies that report to the SEC since the data comes from these reports.
😎 Tips
Analyst Estimates
With Wisesheets, you can get analyst estimates for specific financial metrics like revenue, EBITDA, Net income, and more (see available data).
The estimates are sourced from reports made by top analysts from financial firms such as Morgan Stanley, Citigroup, JP Morgan, amongst others.
To get many analyst estimates at once for a particular company, you can do this:
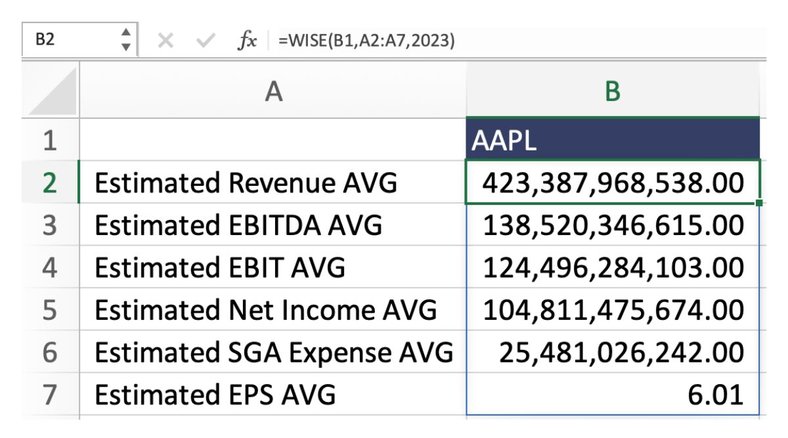
Note that analyst estimates are currently limited up to 2029. Historical data from previous years is also available.
😎 Tips
Price Estimates
With Wisesheets, you can get analyst consensus price estimates for thousands of companies. Parameters available include Last Month Avg Price Target, Last Quarter Avg Price Target and more (see available data).
The estimates are sourced from analysts across different firms and match very well with what you see on aggregator sites like TipRanks and Yahoo.
To get price estimates for a set of companies at once, you can do this:
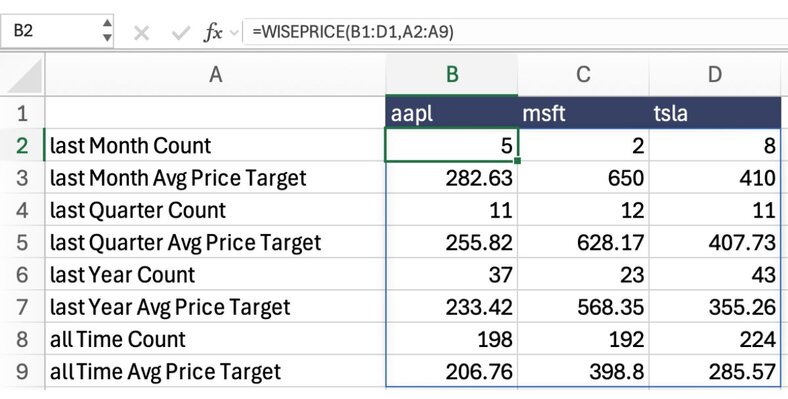
Note that price estimates are only available on a real-time basis based on the parameters you can see above.
😎 Tips
Analyzing Options Data
You can analyze companies options data on a real-time and historical basis using the WISEOPTIONS function. For example to get the whole option chain of strike prices for calls for Apple you can do =WISEOPTIONS("AAPL", "Call", "Strike")
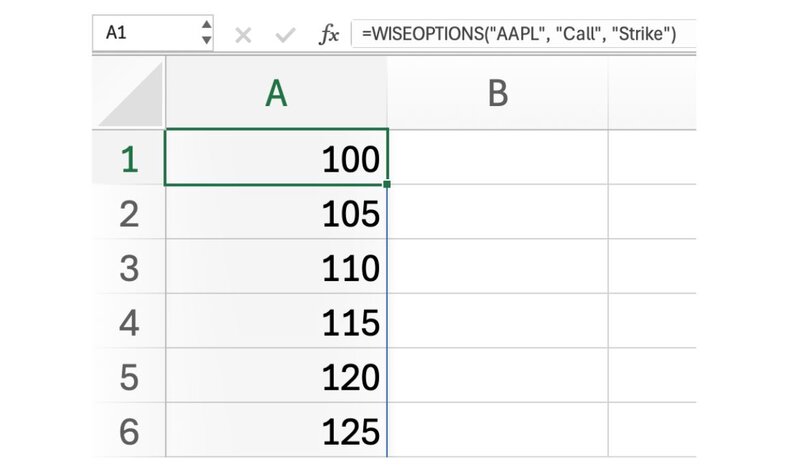
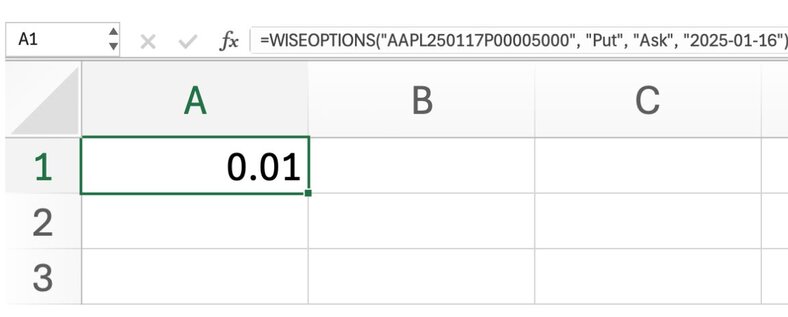
You can also enter the specific contract ID instead of the ticker to get just that one value. For example, to get the bid for Apple's put option AAPL250117P00005000 on the 16th of January 2016, you can do: =WISEOPTIONS("AAPL250117P00005000", "Put", "Bid", "2025-01-16")
ETF/Fund Data
Besides being able to get live price data, historical price data, and dividend data using the WISE and WISEPRICE functions. You can now use the WISEFUNDS function to get ETF specific data like nav, expense ratios, assets under management, etc (see available data). For example to get the nav, aum and expense ratio for the SPY ETF you can do the following:
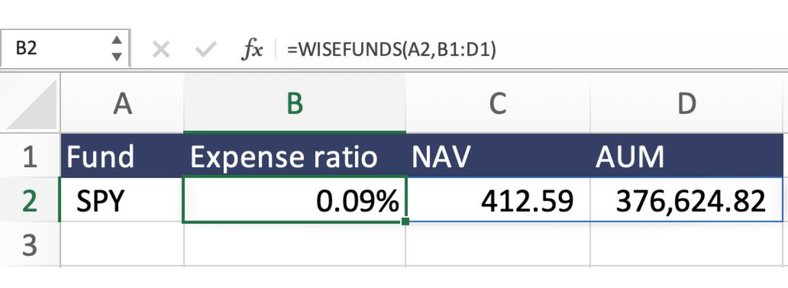
This provides you with the data you need for your funds in real-time. Note that this function is in beta, and more funds and ETFs will be added.
Custom Screener (Get List)
Wisesheets Elite plan members can find companies that meet their specific criteria. Here is how that works:
- Navigate to the screener tab of the add-on and select Get List.
- Enter the filters you would like to search for. This includes market cap, dividend yield, sector, industry, exchange, etc.
- Click on Get data once you are ready.
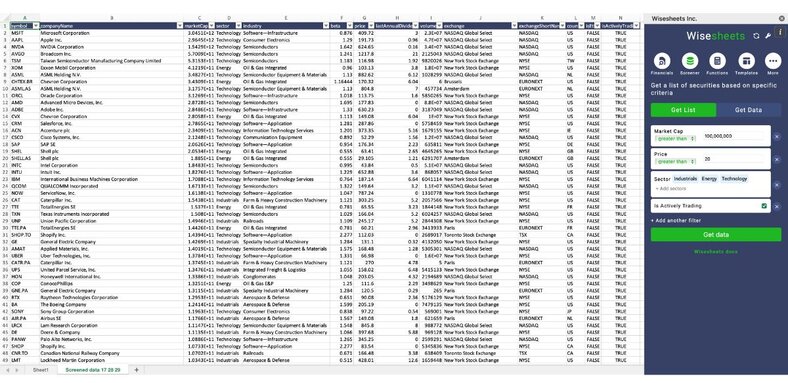
This will return a list of companies, ETFs and or funds that meet your desired criteria, along with available information such as company name, sector, industry, beta price, etc. You can take this list of tickers and get any additional information and metrics you want at once following the method below.
Custom Screener (Get Data)
Building a custom-made stock screener and obtaining the necessary data is made simple with Wisesheets (Pro and Elite members). Here's all you need to do:
- Get a list of stocks in your Excel or Google Sheets spreadsheet. Remember, we use the same ticker system as Yahoo Finance. You can also use the screener get list data functionality from above to get the data in real time.
- Select the parameters for which you'd like to retrieve data. This includes the income statement, balance sheet, cash flow statement, key metrics, growth metrics, and real-time price data. You can refer to this link for the full list of items.
Once you have the list of stocks and parameters set up, you can easily proceed to the next steps. Simply navigate to the Functions section of the add-in. Make sure that you have smart detection enabled. This will allow you to get the data for all of your list of tickers at once.
You can easily refresh the screener data by utilizing the refresh button at the top right of the add-on, which allows you to obtain the latest data at any time.
Track/Compare Crypto
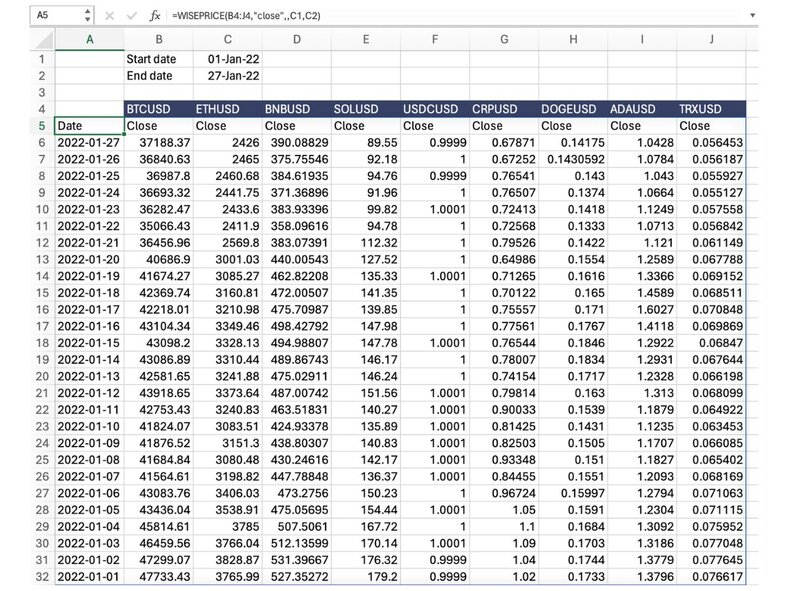
Comparing or tracking cryptocurrencies with Wisesheets is very simple. Here is a full list of the cryptocurrencies currently offered (over 4,700). You can also simply use the Yahoo Finance ticker system without the "-". For example, Yahoo uses BTC-USD for Bitcoin's price in US dollars. We use BTCUSD. There are two types of data you can get from cryptocurrencies live data and historical price data. Using live data you can track or compare cryptocurrencies using the WISEPRICE function like this:

This will allow you to access the live price and other relevant information about the cryptocurrencies you have chosen. You can use the refresh data button at the top of the right add-on at any time to update the functions and view the latest live data. Historical price data is equally easy to access with the WISEPRICE function. For example, to get the close price for the last 10 days of Bitcoin in US dollars, you need to enter =WISEPRICE("BTCUSD", "Close", 10) Or you can also get this data in a specific timeframe, for example, =WISEPRICE("BTCUSD", "Close", ,"01/01/2024", "01/30/2024") You can get historical data for many cryptocurrencies at once like this:
Forex Currency Rates
Comparing or tracking foreign exchange currencies with Wisesheets is very simple. Here is a full list of the currencies currently offered (over 1,540). You can also simply use the Yahoo Finance ticker system without the "=x". For example, Yahoo uses CADUSD=X for the Canadian dollar price in US dollars. We use CADUSD. There are two types of data you can get from foreign currencies live data and historical price data. Using live data you can track or compare currency rates using the WISEPRICE function like this:
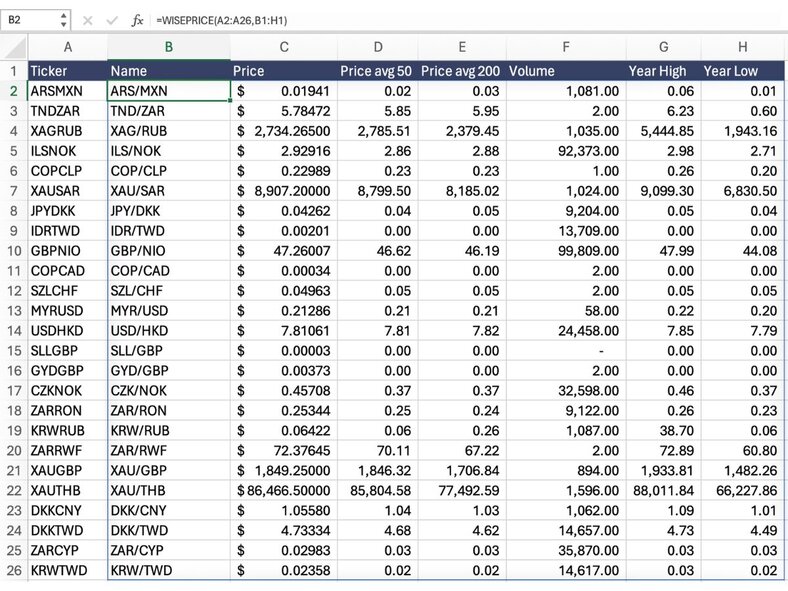
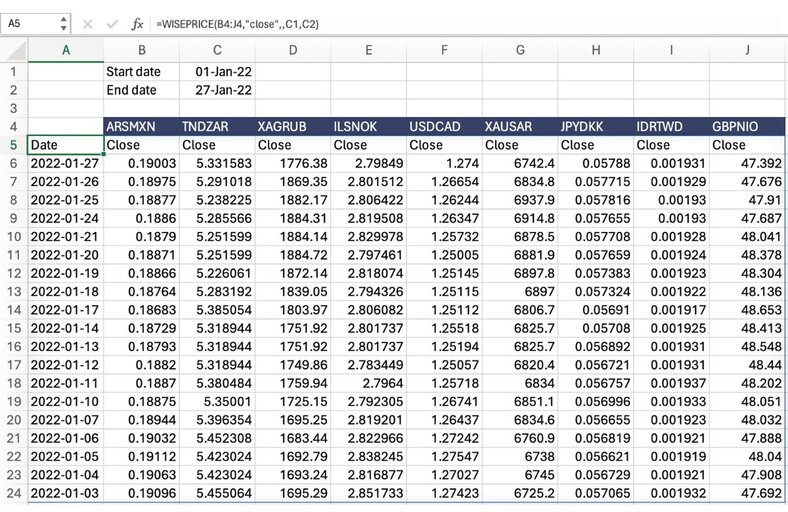
This allows you to access the live price and other relevant information about the currency rates you have chosen. You can use the refresh data button at the top of the right add-on at any time to update the functions and view the latest live data. Historical price data is equally easy to access with the WISEPRICE function. For example, to get the currency rate close for the last 10 days of US dollars to Canadian dollars, you need to enter =WISEPRICE("USDCAD", "Close", 10) Or you can also get this data in a specific timeframe, for example, =WISEPRICE("USDCAD", "Close", ,"01/01/2024", "01/30/2024") You can get historical data for many currencies at once like this:
Commodities/Futures Analysis
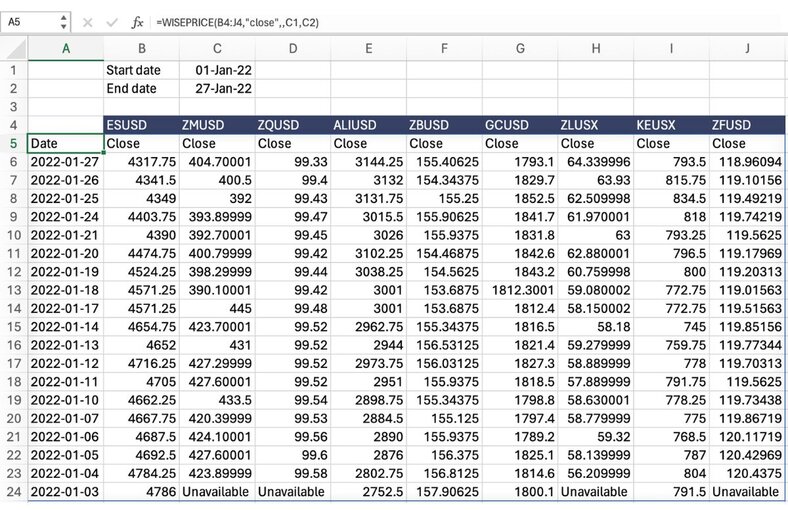
Analyzing commodities and futures with Wisesheets is very simple. Here is a full list of commodities/futures currently offered (over 40). Just make sure to use the exact symbols outlined in the list. There are two types of data you can get from commodities and futures live data and historical price data. Using live data you can track or compare prices using the WISEPRICE function like this:
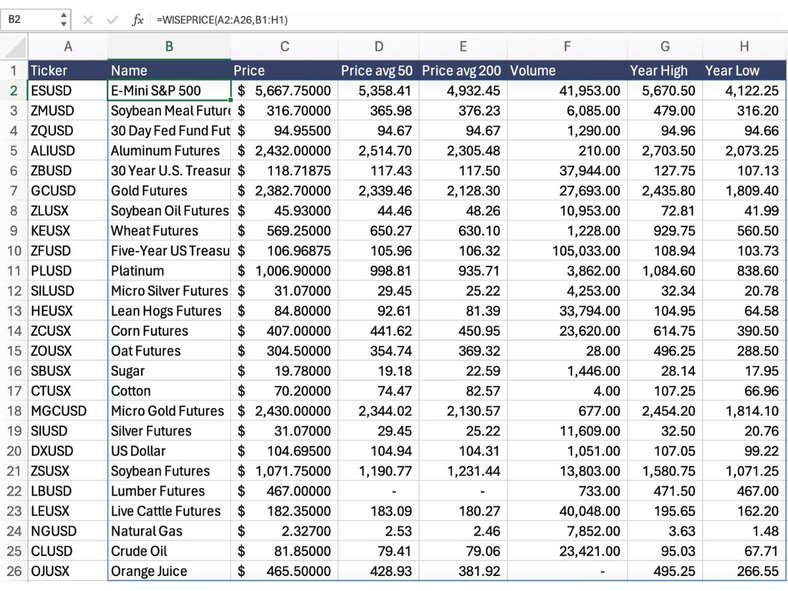
This allows you to access the live price and other relevant information about the commodities you have chosen. You can use the refresh data button at the top of the right add-on at any time to update the functions and view the latest live data. Historical price data is equally easy to access with the WISEPRICE function. For example, to get the commodity close price for the last 10 days of soybean meal futures, you need to enter =WISEPRICE("ZMUSD", "Close", 10) Or you can also get this data in a specific timeframe, for example, =WISEPRICE("ZMUSD", "Close", ,"01/01/2024", "01/30/2024") You can get historical data for many commodities at once like this:
Indices Tracking
Whether you'd like to compare your investment performance or track your investment in indices like the S&P 500, getting data for indices with Wisesheets is very simple. Here is a full list of the currencies currently offered (over 190). Just make sure to use the exact symbols outlined in the list or use the Yahoo Finance ticker system. There are two types of data you can get from indices: live data and historical price data. Using live data, you can track or compare indices prices using the WISEPRICE function like this:
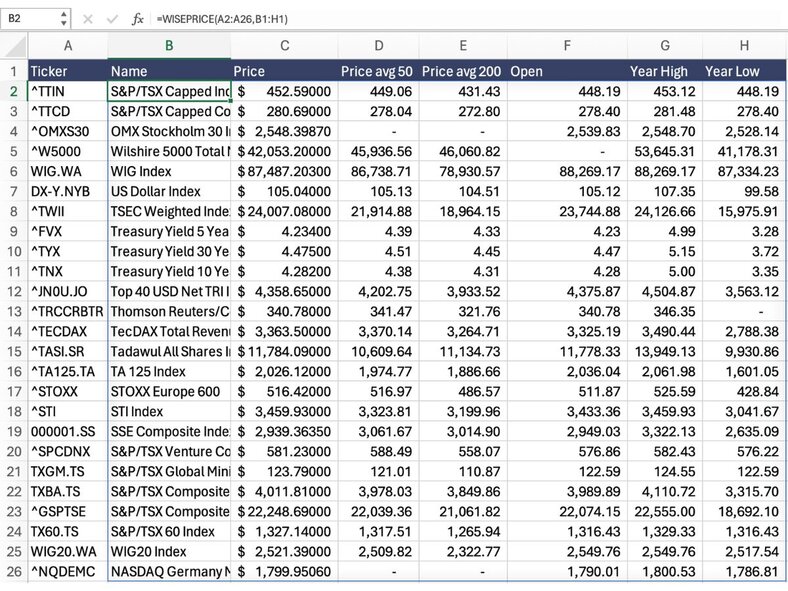
This allows you to access the live price and other relevant information about the indices you have chosen. You can use the refresh data button at the top of the right add-on at any time to update the functions and view the latest live data. Historical price data is equally easy to access with the WISEPRICE function. For example, to get the S&P 500 close price for the last 10 days, you need to enter =WISEPRICE("^GSPC", "Close", 10) Or you can also get this data in a specific timeframe, for example, =WISEPRICE("^GSPC", "Close", ,"01/01/2024", "01/30/2024") You can get historical data for many indices at once like this:

Common Issues
These are the most common issues when using the add-on along with their solutions.
Cannot Find Stock Ticker to use for International Stocks
Wisesheets uses the same ticker system as Yahoo Finance. You can use their search or, better yet, the statement dump search to find the right ticker to use.
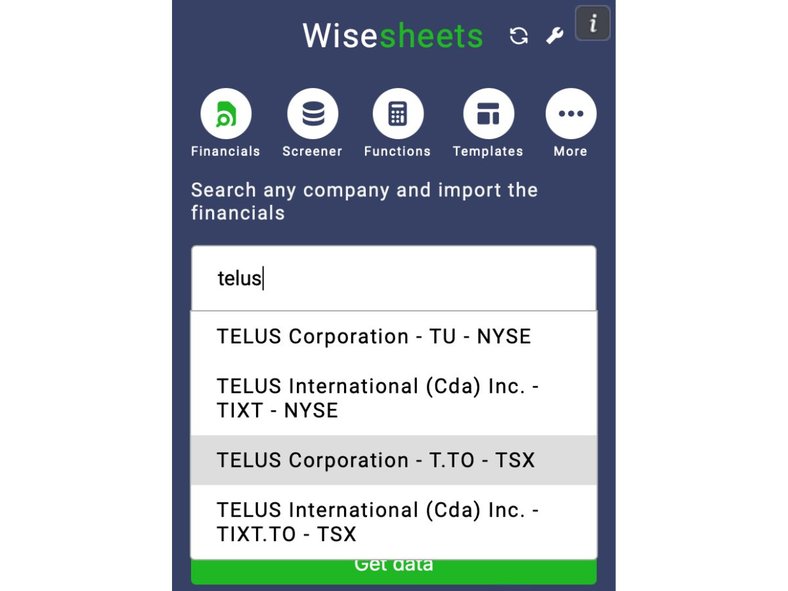
You can enter the regular ticker followed by the exchange extension. For example, for Telus, a Canadian company listed in the TSX, the ticker is "T" and the extension is ".TO". You can enter "T.TO" to get the data for this company (see available exchanges and their extensions).
Unable to Login on Google Sheets
Sometimes Chrome extensions or adblockers may block our authentication system, which allows us to recognize your account. Alernatively there is an issue with Google allowing us to authenticate your account when being logged into multiple Google accounts at once. In either case don't worry you can fix this by following these simple solutions.
Solutions
Solution 1:
Solution 2:
Functions Return #name Not Recognized by Excel
It is possible that when you download Wisesheets on Excel, you are able to use the statement dump function but unable to use the custom functions. In most cases, this is because Microsoft requires users to have an Office 365 account to access custom spreadsheet functions.
Solutions
Cells Contain _xldufd_ in Excel
This typically happens when you save your Excel files on a cloud server like one drive or have an existing add-on affecting the custom function. Don't worry. There is an easy way to fix all the function calls at once and a way to prevent this from happening altogether.
Solutions
1. Press the “Refresh Errors” button at the top right of the add-on; this will identify those cells and clean them up for you at once:

2. Excel allows you to replace all the cell contents in a tab at once. Simply head to replace.
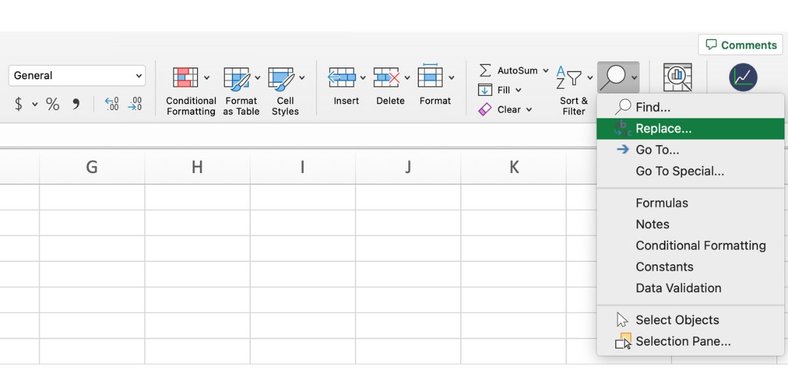
Replace all with everything behind the function like _xlduf_ … with nothing.
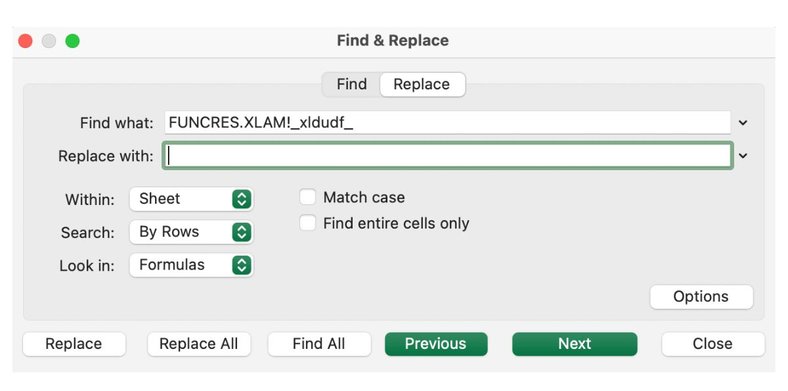
This will fix all cells at once.
Prevention
To prevent this from happening altogether here are two different things you can try:
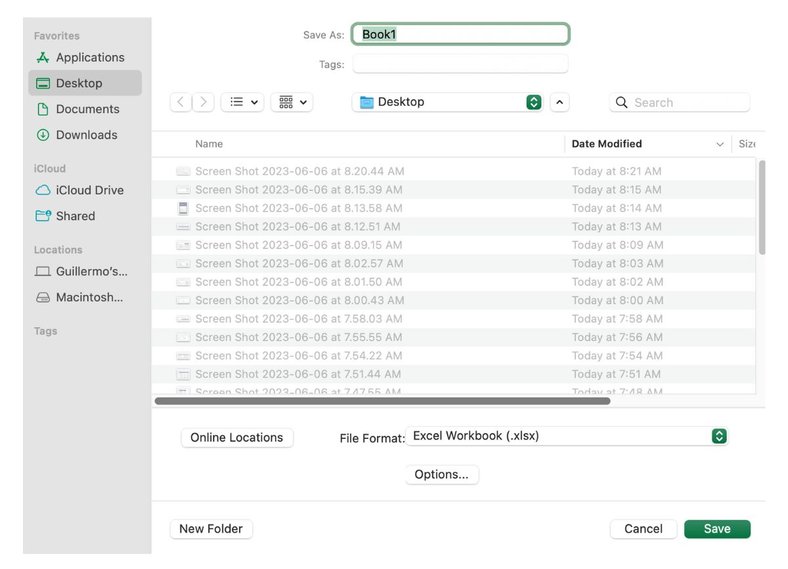
URL Fetch Error
URL fetch is a limit that Google Sheets has for requesting data. Every time you make a function call, a URL fetch call is made to retrieve the data. Google limits these calls to 20k per day for regular users and 100k for paid accounts. This limit resets automatically every day.
Solutions
There are two solutions. The first is to use the screener functionality as shown here. The second is using ranges in the functions so you can get more data faster while making fewer function calls.

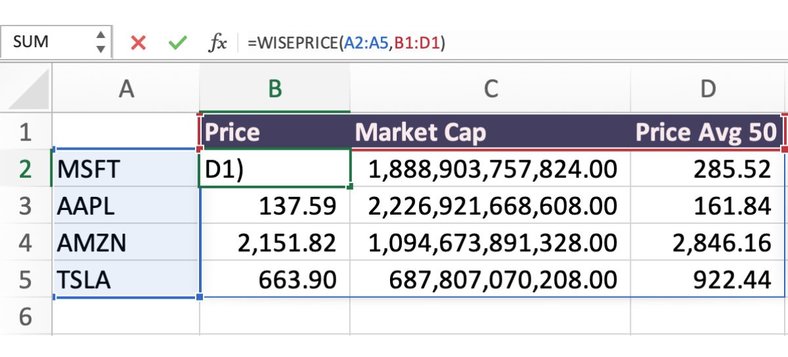
Alternatively, you can use Wisesheets on Excel, where there are no URL fetch limits, or upgrade your Google account to an enterprise account.
#SPILL Error
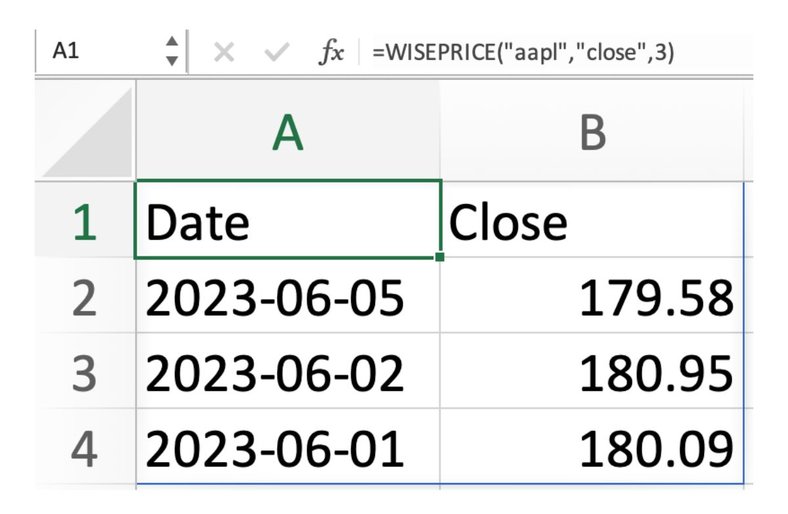
The spill error happens in Excel or Google Sheets when the function you use returns an array (multiple values in one single function), and there is no space for the data to be displayed. For example, if you do =WISEPRICE("AAPL", "close", 3), this will return an array with the date and close price for the past 3 trading days.
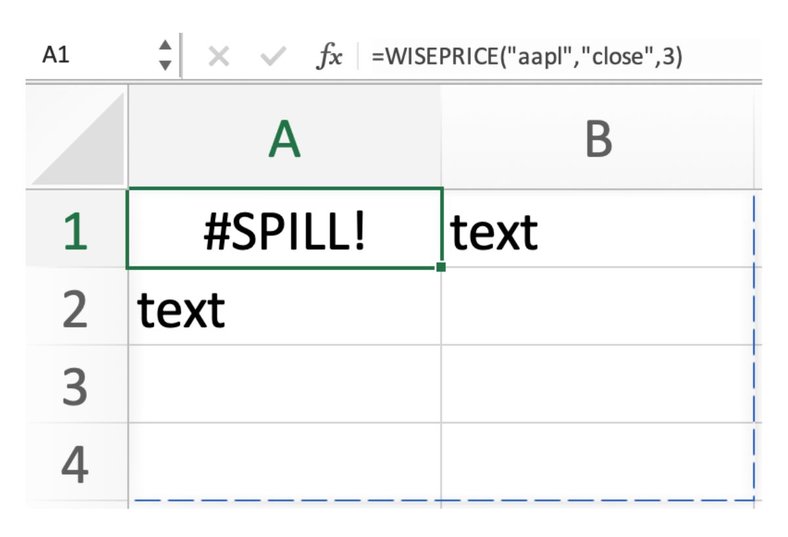
As you can see, this returns in the #spill error because there is data blocking the function from showing the values.
Solution
Fixing this error is simple, all you need to do is clear all the data that interferes with the function calls you are making, and you will see the cell will clear and you will be able to get the data you want.
