Texas Instruments Incorporated
TXN
Price:
$192.44
Market Cap:
$175.55B
Texas Instruments Incorporated designs, manufactures, and sells semiconductors to electronics designers and manufacturers worldwide. It operates in two segments, Analog and Embedded Processing. The Analog segment offers power products to manage power requirements in various levels using battery-management solutions, DC/DC switching regulators, AC/DC and isolated controllers and converters, power switches, linear regulators, voltage supervisors, voltage references, and lighting products. This segment also provides signal chain products that sense, condition, and measure signals to allow information to be transferred or converted for further processing and control for use in end markets, inclu...[Read more]
Industry
Semiconductors
IPO Date
1972-06-01
Stock Exchange
NASDAQ
Ticker
TXN
PE Ratio
[35.77]
ROE
[29.05%]
Current Ratio
[4.31]
Dividend Yield
[2.73%]
Enterprise Value
[187.53B]
Dividend History
TXN Dividend History Overview
Dividends are a key part of long-term returns for investors, and Texas Instruments Incorporated (TXN) has a track record worth reviewing. Looking at dividend history for TXN gives you an idea of how consistent the dividends have been and what you might expect in the future.
Ex-Dividend Date
2024-10-31
Dividend Yield
2.73%
Annual Dividend
$1.36
P/E Ratio
35.77
Payout Ratio
0.95
Dividend per Share
$5.26
EPS
5.38
| Ex-Date/EFF Date | Dividend Amount | Adjusted Dividend | Payment Date | Declaration Date |
|---|---|---|---|---|
| 2024-10-31 | $1.36 | $1.36 | 2024-11-12 | 2024-09-19 |
| 2024-07-31 | $1.3 | $1.3 | 2024-08-13 | 2024-07-18 |
| 2024-05-07 | $1.3 | $1.3 | 2024-05-21 | 2024-04-25 |
| 2024-01-30 | $1.3 | $1.3 | 2024-02-13 | 2024-01-18 |
| 2023-10-30 | $1.3 | $1.3 | 2023-11-14 | 2023-09-21 |
| 2023-07-28 | $1.24 | $1.24 | 2023-08-15 | 2023-07-20 |
| 2023-05-05 | $1.24 | $1.24 | 2023-05-16 | 2023-04-27 |
| 2023-01-30 | $1.24 | $1.24 | 2023-02-14 | 2023-01-19 |
| 2022-10-28 | $1.24 | $1.24 | 2022-11-15 | 2022-09-15 |
| 2022-07-29 | $1.15 | $1.15 | 2022-08-16 | 2022-07-21 |
| 2022-05-06 | $1.15 | $1.15 | 2022-05-17 | 2022-04-28 |
Texas Instruments Incorporated (TXN) Dividend History Chart
The table below shows Texas Instruments Incorporated (TXN) dividend history over the years, including the amount per share, the payout date, and any adjustments for stock splits.
Texas Instruments Incorporated (TXN) Dividend Growth
Texas Instruments Incorporated (TXN) dividend history also allows you to track its dividend growth over time. This gives you insight into how the company’s earnings and payout ratios have evolved. Tracking this growth can help you gauge the stock's potential for future income.
Other Popular Dividend Stocks
Check out the dividend history of other popular stocks:
| Stock name | Dividend yield |
|---|---|
| Microchip Technology Incorporated (MCHP) | 0.03% |
| Monolithic Power Systems, Inc. (MPWR) | 0.01% |
| NXP Semiconductors N.V. (NXPI) | 0.02% |
| Analog Devices, Inc. (ADI) | 0.02% |
| Broadcom Inc. (AVGO) | 0.01% |
| Micron Technology, Inc. (MU) | 0.01% |
| Intel Corporation (INTC) | 0.02% |
| Marvell Technology, Inc. (MRVL) | 0.00% |
| QUALCOMM Incorporated (QCOM) | 0.02% |
Track & Identify Dividend Stocks
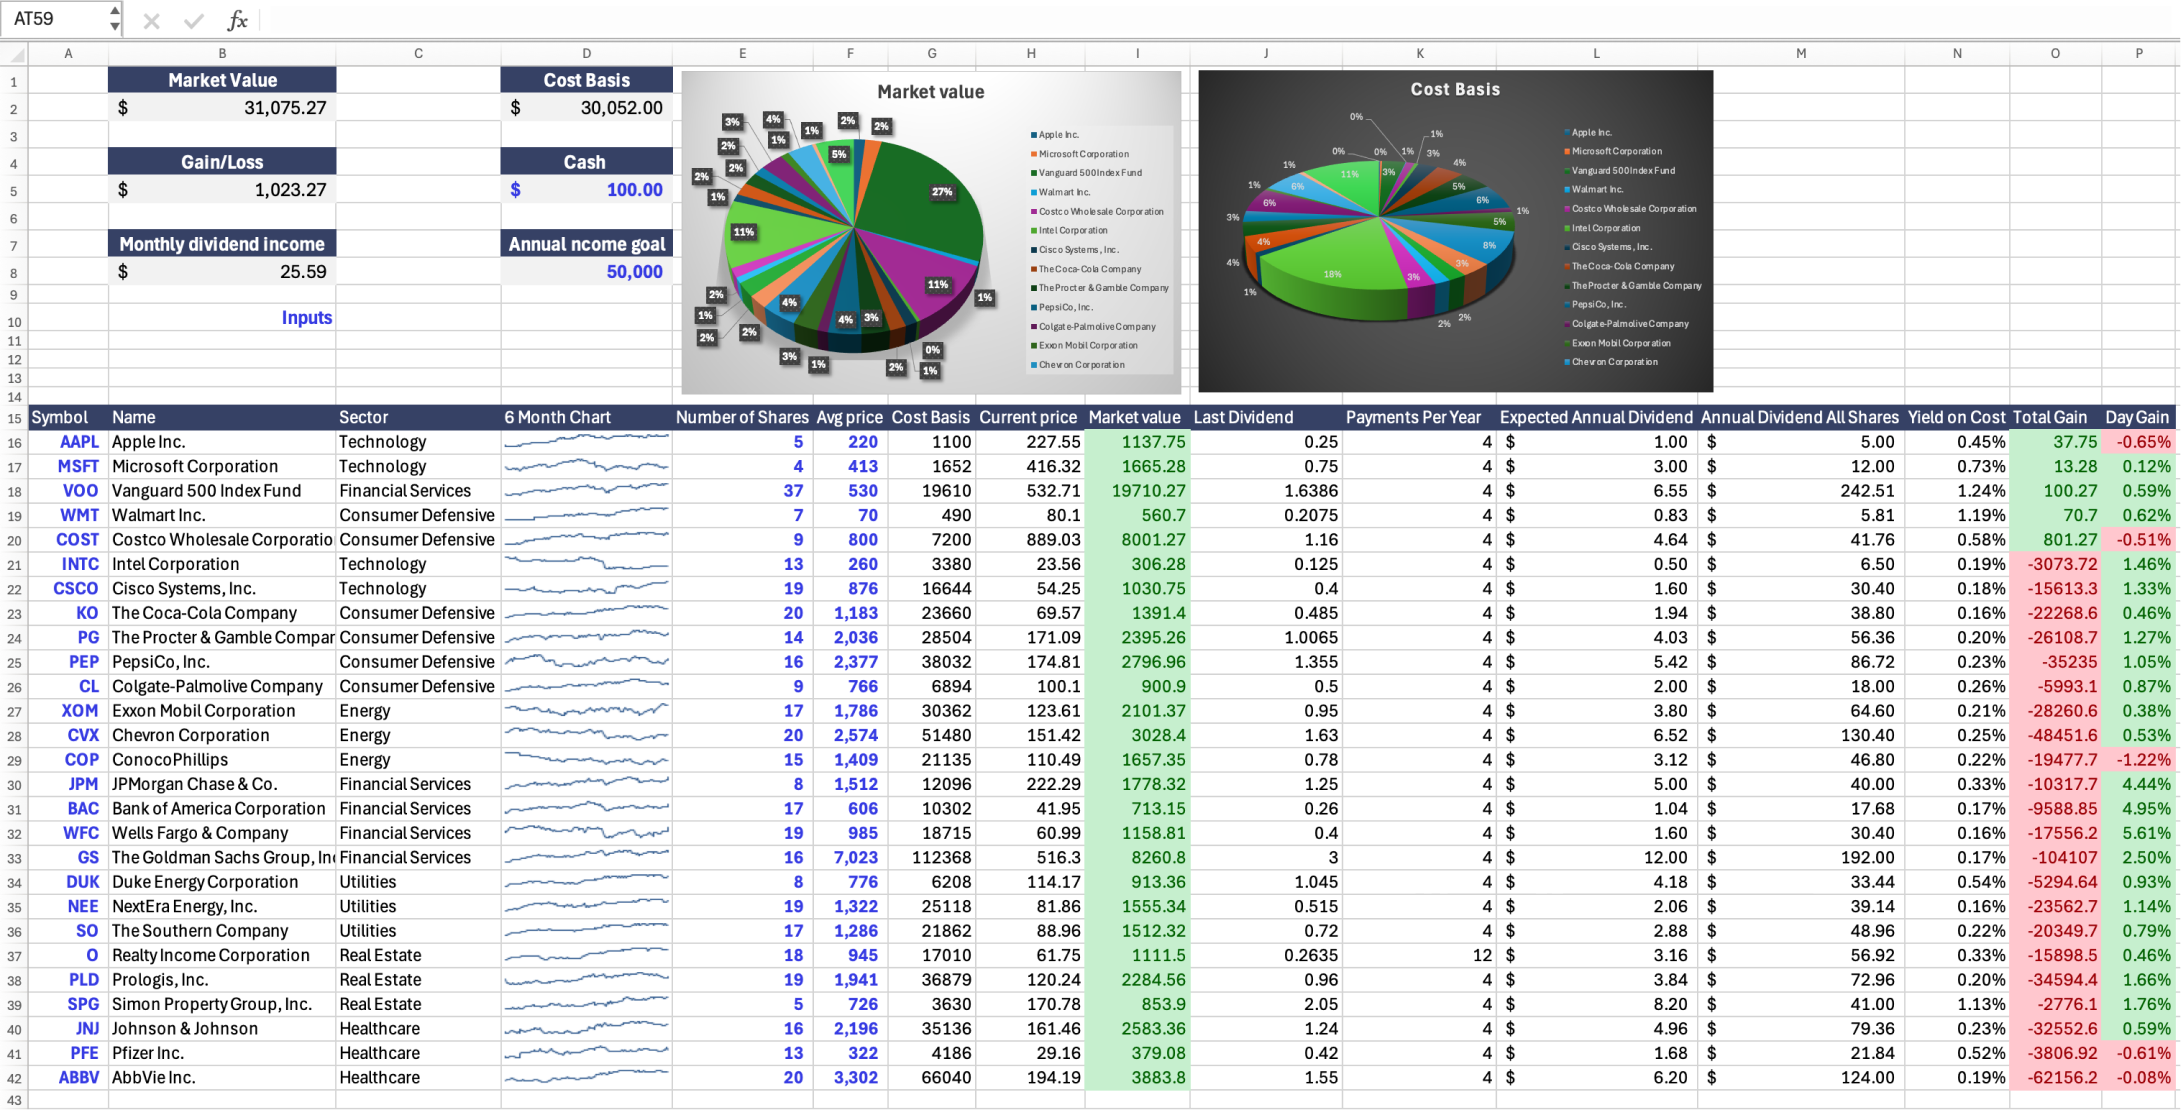
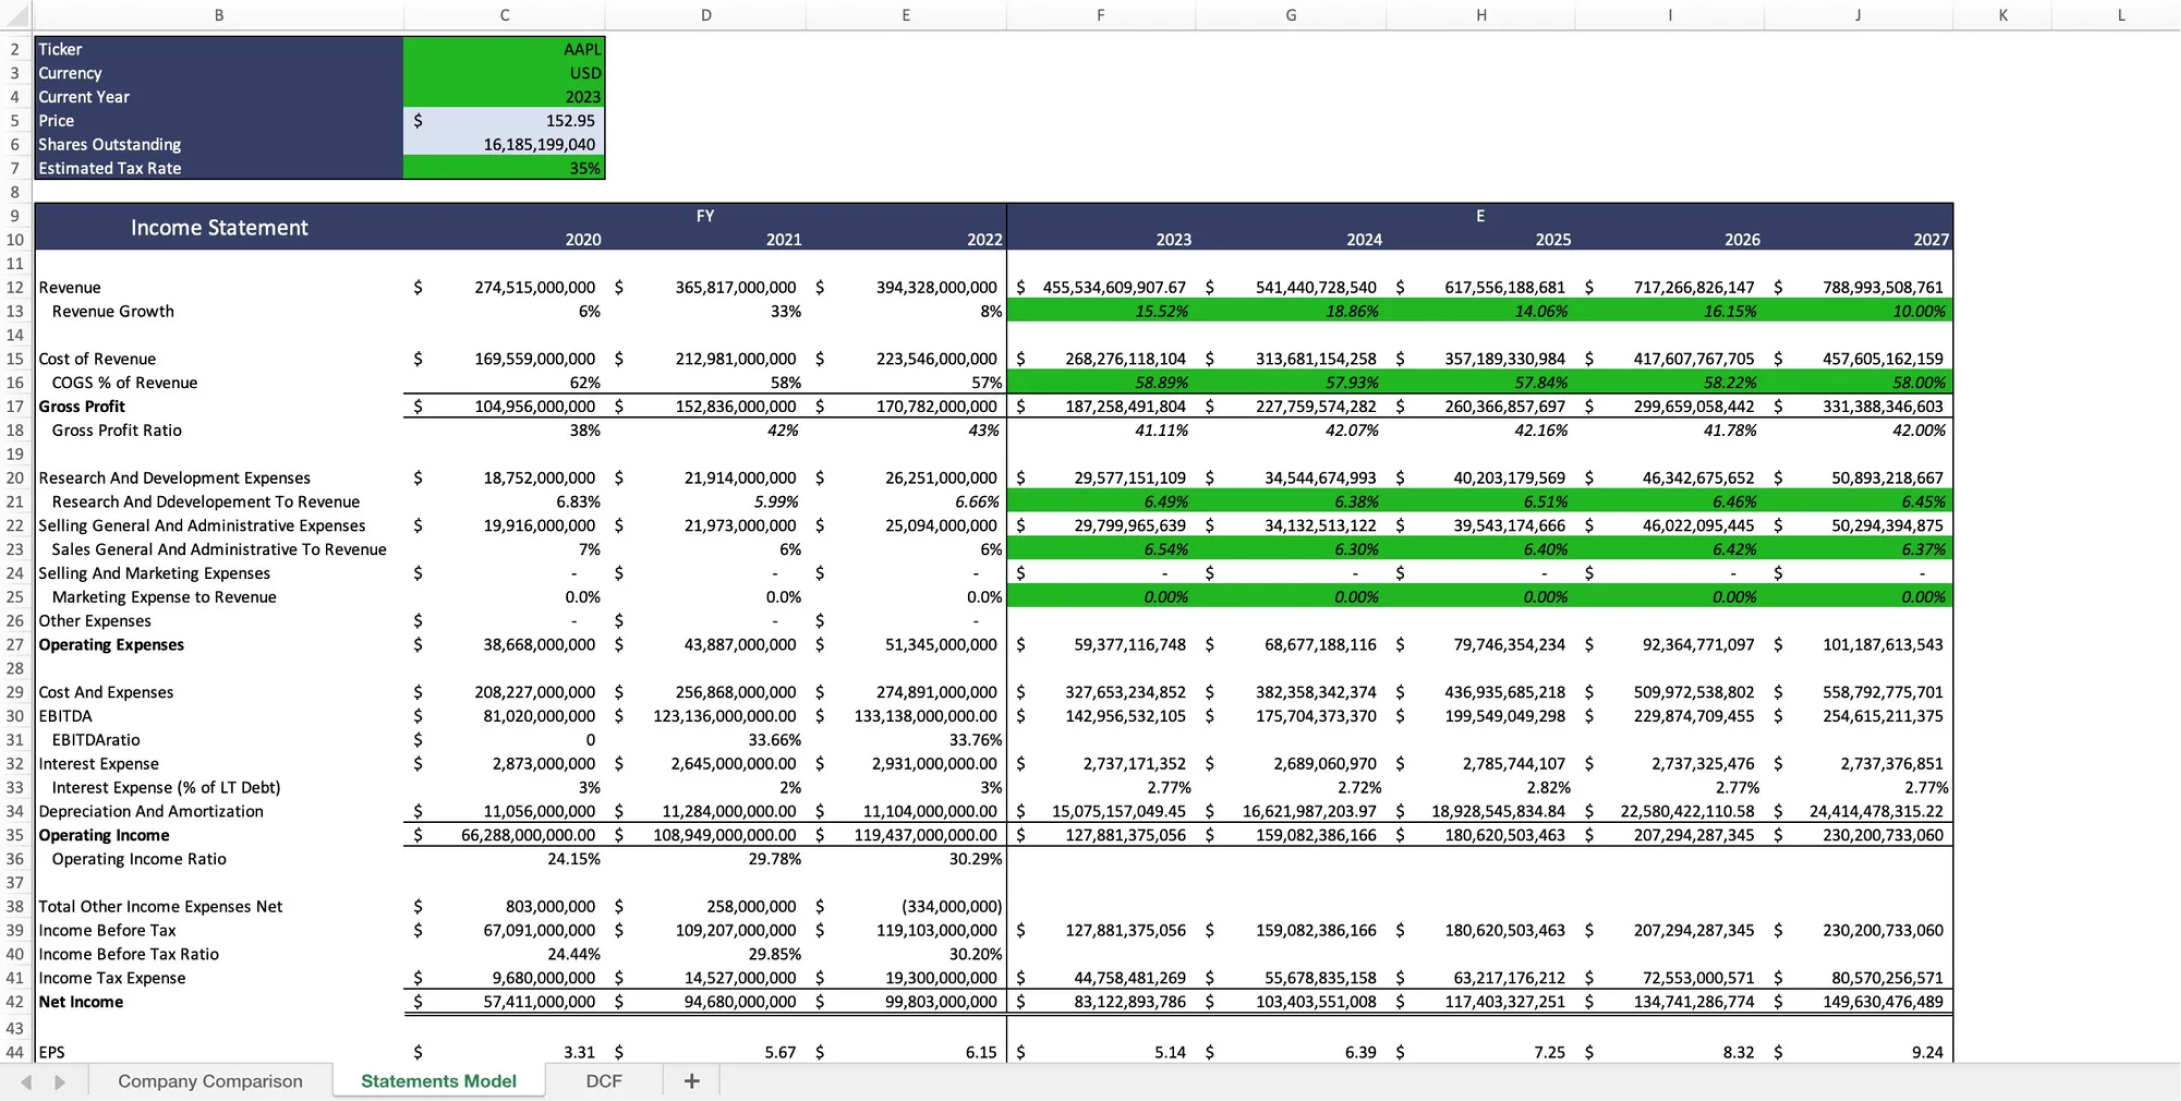
Tracking and finding valuable dividend stocks to invest in is difficult. For this, you can use Wisesheets, which allows you to pull all necessary dividend, financial, and price data to track your dividend investments in one place exactly how you want, using the power of spreadsheets.
You can build any custom analysis dashboards, screeners and trackers with no code and analyze companies like Texas Instruments Incorporated (TXN) without the pain and hassle of copy pasting data.
Frequently asked questions❓
What is dividend history?
How do I check past dividend history?
What does the ex-dividend date mean?
What is TXN’s dividend yield?
What is the difference between regular and special dividends?
Has TXN increased its dividends over time?
Why might dividend history data be delayed?
How often does TXN pay dividends?
What factors impact TXN's dividend payments?
Can dividends change over time?
What is TXN’s next dividend date?

