Kenon Holdings Ltd.
KEN
Price:
$32.15
Market Cap:
$1.70B
Kenon Holdings Ltd., through its subsidiaries, operates as an owner, developer, and operator of power generation facilities in Israel, the United States, and internationally. It operates in four segments: OPC Israel, CPV Group, ZIM, and Quantum. The company engages in the generation and supply of electricity and energy; development, construction, and management of renewable energy and conventional natural gas-fired power plants; manufacture of automobiles; and provision of container liner shipping services. As of December 31, 2021, the company had an installed capacity of approximately 610 MW; and operated a fleet of 118 vessels. The company was incorporated in 2014 and is based in Singapore...[Read more]
Industry
Independent Power Producers
IPO Date
2015-01-15
Stock Exchange
NYSE
Ticker
KEN
PE Ratio
[10.05]
ROE
[15.15%]
Current Ratio
[3.78]
Dividend Yield
[11.82%]
Enterprise Value
[2.61B]
Dividend History
KEN Dividend History Overview
Dividends are a key part of long-term returns for investors, and Kenon Holdings Ltd. (KEN) has a track record worth reviewing. Looking at dividend history for KEN gives you an idea of how consistent the dividends have been and what you might expect in the future.
Ex-Dividend Date
2024-04-05
Dividend Yield
11.82%
Annual Dividend
$3.80
P/E Ratio
10.05
Payout Ratio
1.18
Dividend per Share
$3.80
EPS
3.20
| Ex-Date/EFF Date | Dividend Amount | Adjusted Dividend | Payment Date | Declaration Date |
|---|---|---|---|---|
| 2024-04-05 | $3.8 | $3.8 | 2024-04-15 | 2024-03-26 |
| 2023-04-10 | $2.79 | $2.79 | 2023-04-19 | 2023-03-30 |
| 2022-06-24 | $10.25 | $10.25 | 2022-07-05 | 2022-03-31 |
| 2022-01-18 | $3.5 | $3.5 | 2022-01-27 | 2021-11-30 |
| 2021-08-24 | $2 | $2 | 2021-09-15 | |
| 2021-04-28 | $1.86 | $1.86 | 2021-05-06 | 2021-04-19 |
| 2020-11-02 | $2.23 | $2.23 | 2020-11-10 | 2020-10-21 |
| 2019-11-15 | $1.21 | $1.21 | 2019-11-26 | 2019-11-04 |
| 2018-12-06 | $1.86 | $1.86 | 2018-12-17 | 2018-11-27 |
| 2018-03-07 | $12.35 | $12.35 | 2018-03-22 | 2017-11-27 |
Kenon Holdings Ltd. (KEN) Dividend History Chart
The table below shows Kenon Holdings Ltd. (KEN) dividend history over the years, including the amount per share, the payout date, and any adjustments for stock splits.
Kenon Holdings Ltd. (KEN) Dividend Growth
Kenon Holdings Ltd. (KEN) dividend history also allows you to track its dividend growth over time. This gives you insight into how the company’s earnings and payout ratios have evolved. Tracking this growth can help you gauge the stock's potential for future income.
Other Popular Dividend Stocks
Check out the dividend history of other popular stocks:
| Stock name | Dividend yield |
|---|---|
| Vistra Corp. (VST) | 0.01% |
| NRG Energy, Inc. (NRG) | 0.02% |
| AGL Energy Limited (TAC) | 0.01% |
| Datang International Power Generation Co., Ltd. (AGLXY) | 0.05% |
| (DIPGF) | 0.00% |
Track & Identify Dividend Stocks
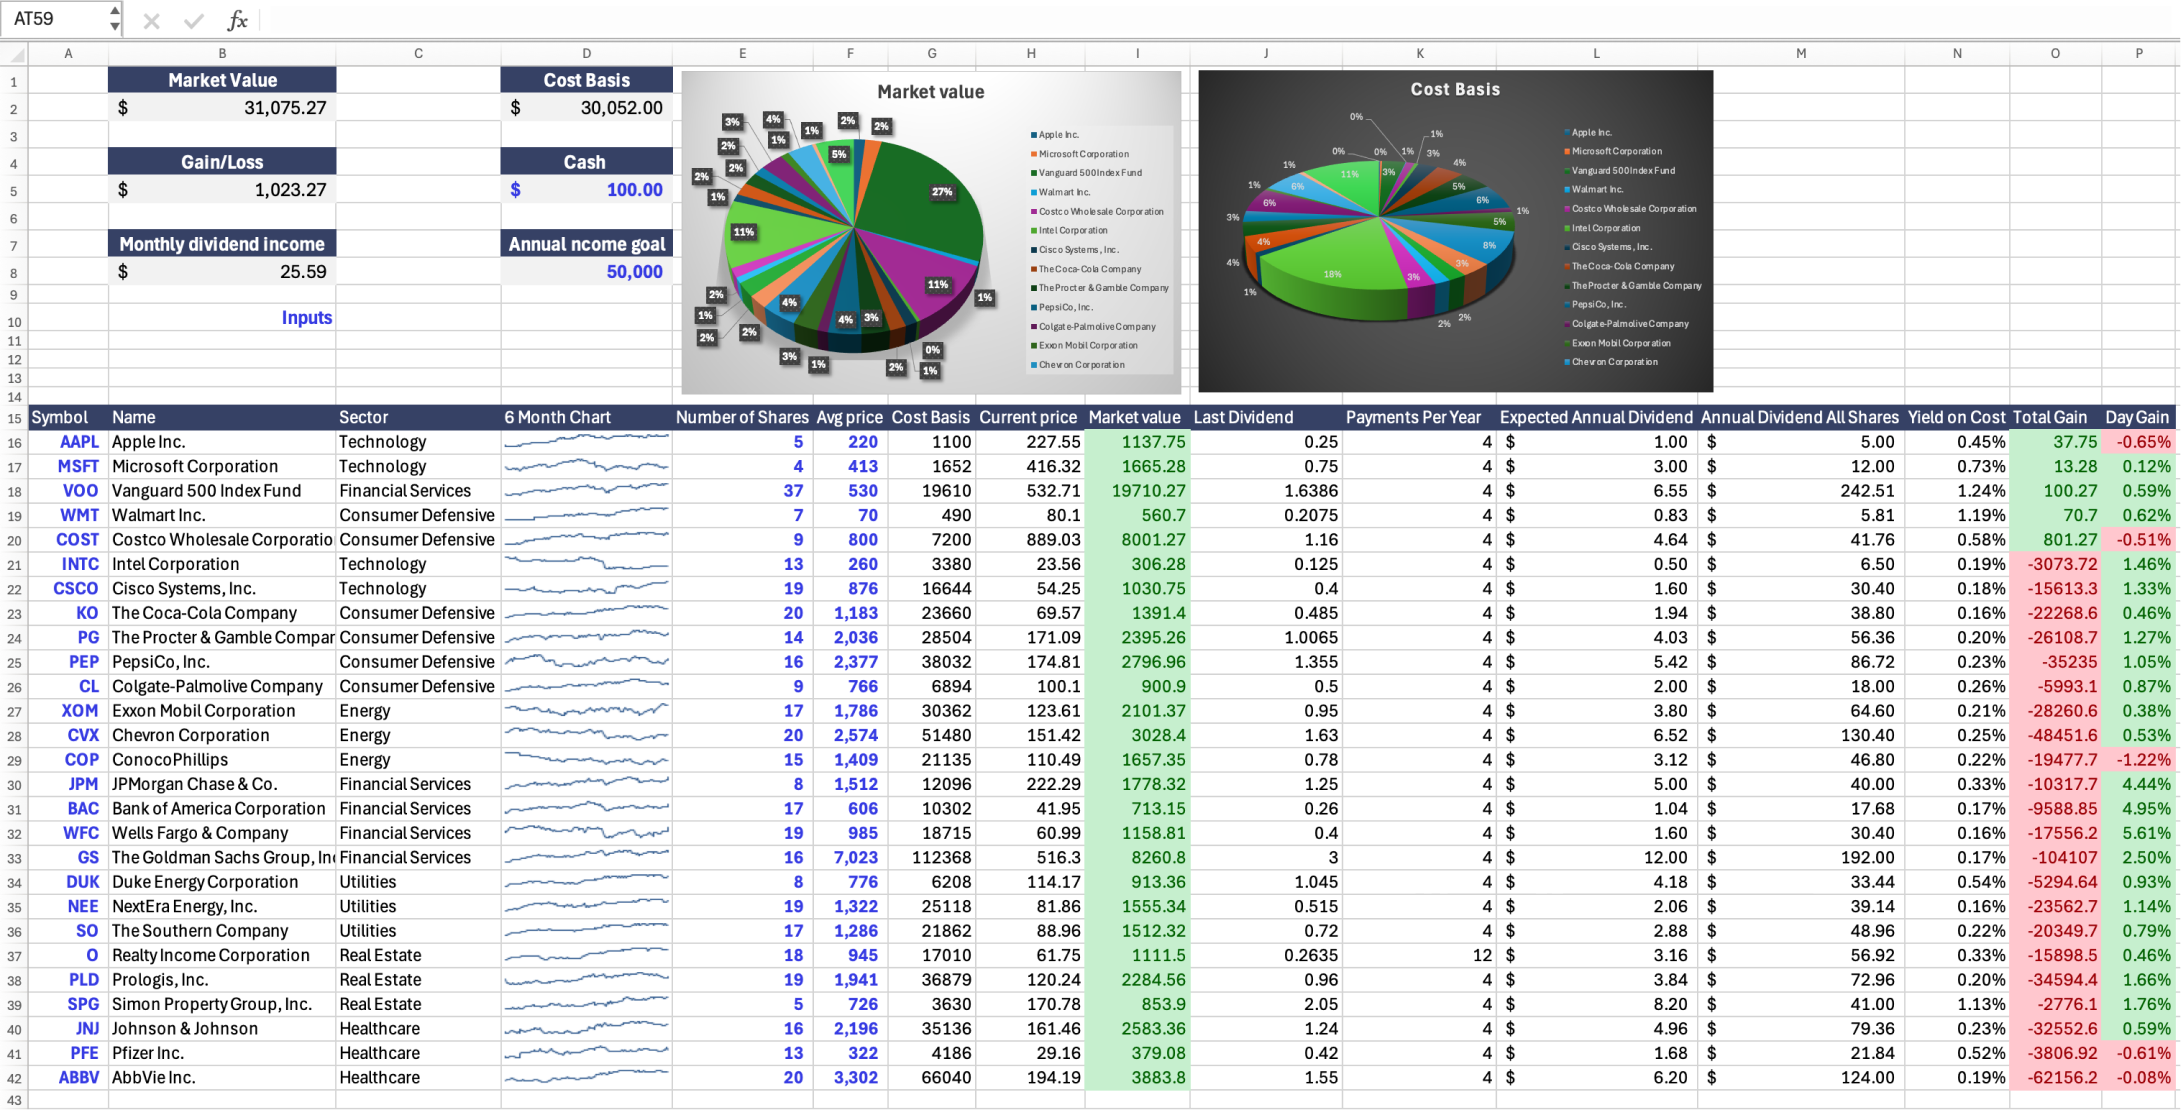
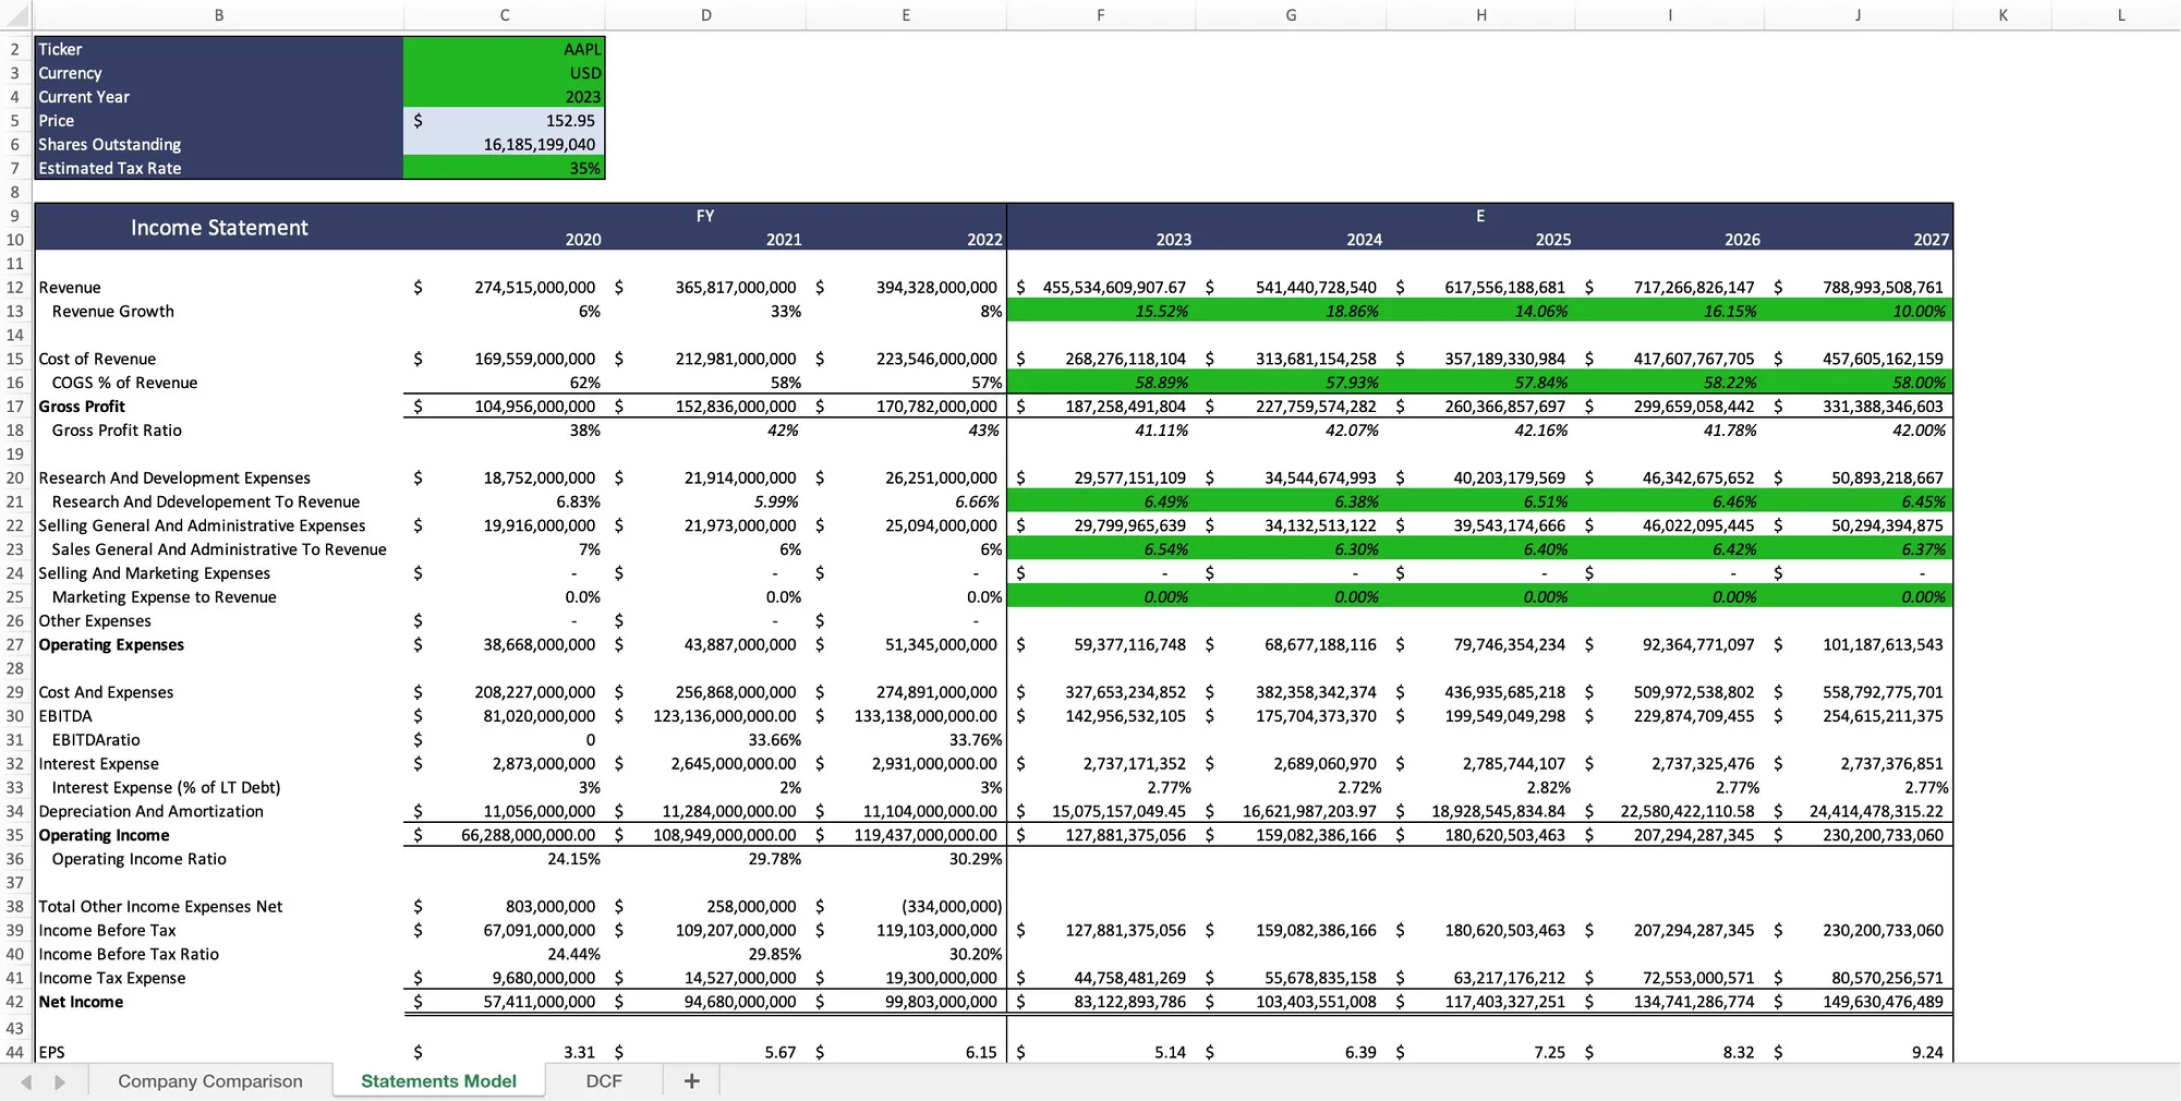
Tracking and finding valuable dividend stocks to invest in is difficult. For this, you can use Wisesheets, which allows you to pull all necessary dividend, financial, and price data to track your dividend investments in one place exactly how you want, using the power of spreadsheets.
You can build any custom analysis dashboards, screeners and trackers with no code and analyze companies like Kenon Holdings Ltd. (KEN) without the pain and hassle of copy pasting data.
Frequently asked questions❓
What is dividend history?
How do I check past dividend history?
What does the ex-dividend date mean?
What is KEN’s dividend yield?
What is the difference between regular and special dividends?
Has KEN increased its dividends over time?
Why might dividend history data be delayed?
How often does KEN pay dividends?
What factors impact KEN's dividend payments?
Can dividends change over time?
What is KEN’s next dividend date?

