Jacques Bogart S.A.
JBOG.PA
Price:
$5.84
Market Cap:
$85.52M
Jacques Bogart S.A. produces and sells fragrances and cosmetics in Paris and internationally. The company operates a network of 390 perfumeries under own name points of sale, which include 40 in Israel, 32 in France, 95 in Germany, and 224 stores in Belgium and Luxembourg. It markets its fragrance products under the JACQUES BOGART +, CARVEN +, CHEVIGNON +, and TED LAPIDUS + brand names; cosmetic products under the STENDHAL +, METHODE JEANNE PIAUBERT +, and APRIL + brand names; and fashion products under the TED LAPIDUS FASHION + brand name. The company was founded in 1975 and is based in Paris, France.[Read more]
Industry
Household & Personal Products
IPO Date
2000-01-03
Stock Exchange
EURONEXT
Ticker
JBOG.PA
PE Ratio
[14.60]
ROE
[7.28%]
Current Ratio
[1.38]
Dividend Yield
[3.42%]
Enterprise Value
[180.00M]
Dividend History
JBOG.PA Dividend History Overview
Dividends are a key part of long-term returns for investors, and JBOG.PA has a track record worth reviewing. Looking at dividend history for JBOG.PAgives you an idea of how consistent the dividends have been and what you might expect in the future.
Ex-Dividend Date
2024-07-03
Dividend Yield
3.42
Annual Dividend
0.20
P/E Ratio
14.6
Payout Ratio
0.45
Dividend per Share
0.20
EPS
0.4
| Ex-Date/EFF Date | Dividend Amount | Adjusted Dividend | Payment Date | Declaration Date |
|---|---|---|---|---|
| 2024-07-03 | 0.2 | 0.2 | 2024-07-05 | |
| 2023-07-05 | 0.18 | 0.18 | 2023-07-07 | |
| 2022-07-05 | 0.23 | 0.23 | 2022-07-07 | |
| 2021-07-06 | 0.23 | 0.23 | 2021-07-08 | |
| 2021-07-02 | 0.23 | 0.23 | ||
| 2020-07-23 | 0.23 | 0.23 | 2020-07-27 | 2020-06-09 |
| 2019-07-03 | 0.2 | 0.2 | 2019-07-05 | 2019-04-24 |
| 2018-07-04 | 0.17 | 0.17 | 2018-07-06 | 2018-04-27 |
| 2017-07-05 | 0.16 | 0.16 | 2017-07-07 | 2017-05-03 |
| 2016-07-01 | 0.15 | 0.15 | 2016-04-19 | |
| 2015-07-03 | 3 | 0.15 | 2015-07-07 | 2015-05-22 |
| 2014-06-20 | 3.3 | 0.165 | 2014-06-25 | 2014-04-30 |
| 2013-06-26 | 17.55 | 0.8775 | 2013-07-01 | 2013-05-01 |
| 2012-06-18 | 6.3 | 0.315 | 2012-06-21 | 2012-04-27 |
| 2011-07-04 | 4.7 | 0.235 | 2011-07-07 | 2011-05-05 |
| 2010-07-01 | 2.75 | 0.1375 | 2010-04-23 | |
| 2009-07-02 | 8 | 0.4 | 2009-07-07 | 2009-05-27 |
| 2008-07-01 | 65 | 3.25 | 2008-05-14 | |
| 2007-06-28 | 5.2 | 0.26 | 2007-06-28 | 2007-05-11 |
| 2006-06-30 | 4.5 | 0.225 | 2006-06-30 | 2006-05-31 |
| 2005-06-29 | 3 | 0.15 | 2005-06-29 | 2005-05-06 |
| 2004-06-29 | 4.5 | 0.225 | 2004-06-29 | 2004-05-28 |
| 2003-06-23 | 2.5 | 0.125 | 2003-06-23 | 2003-05-19 |
| 2002-06-21 | 1.5 | 0.075 | 2002-06-21 | 2002-06-21 |
| 2001-06-29 | 1.25 | 0.0625 | 2001-06-29 | 2001-05-04 |
| 2000-06-29 | 1 | 0.05 | 2000-06-29 | 2000-06-02 |
| Show less |
JBOG.PA Dividend History Chart
The table below shows JBOG.PA dividend history over the years, including the amount per share, the payout date, and any adjustments for stock splits.
Track JBOG.PA Dividend Growth
JBOG.PA dividend history also allows you to track its dividend growth over time. This gives you insight into how the company’s earnings and payout ratios have evolved. Tracking this growth can help you gauge the stock's potential for future income.
Other Popular Dividend Stocks
JBOG.PA dividend history also allows you to track its dividend growth over time. This gives you insight into how the company's earnings and payout ratios have evolved. Tracking this growth can help you gauge the stock's potential for future income.
| Stock name | Dividend yield |
|---|---|
| Herige (ALHRG.PA) | 0.08 |
| NRJ Group SA (NRG.PA) | 0.05 |
| STEF SA (STF.PA) | 0.04 |
Track & Identify Dividend Stocks
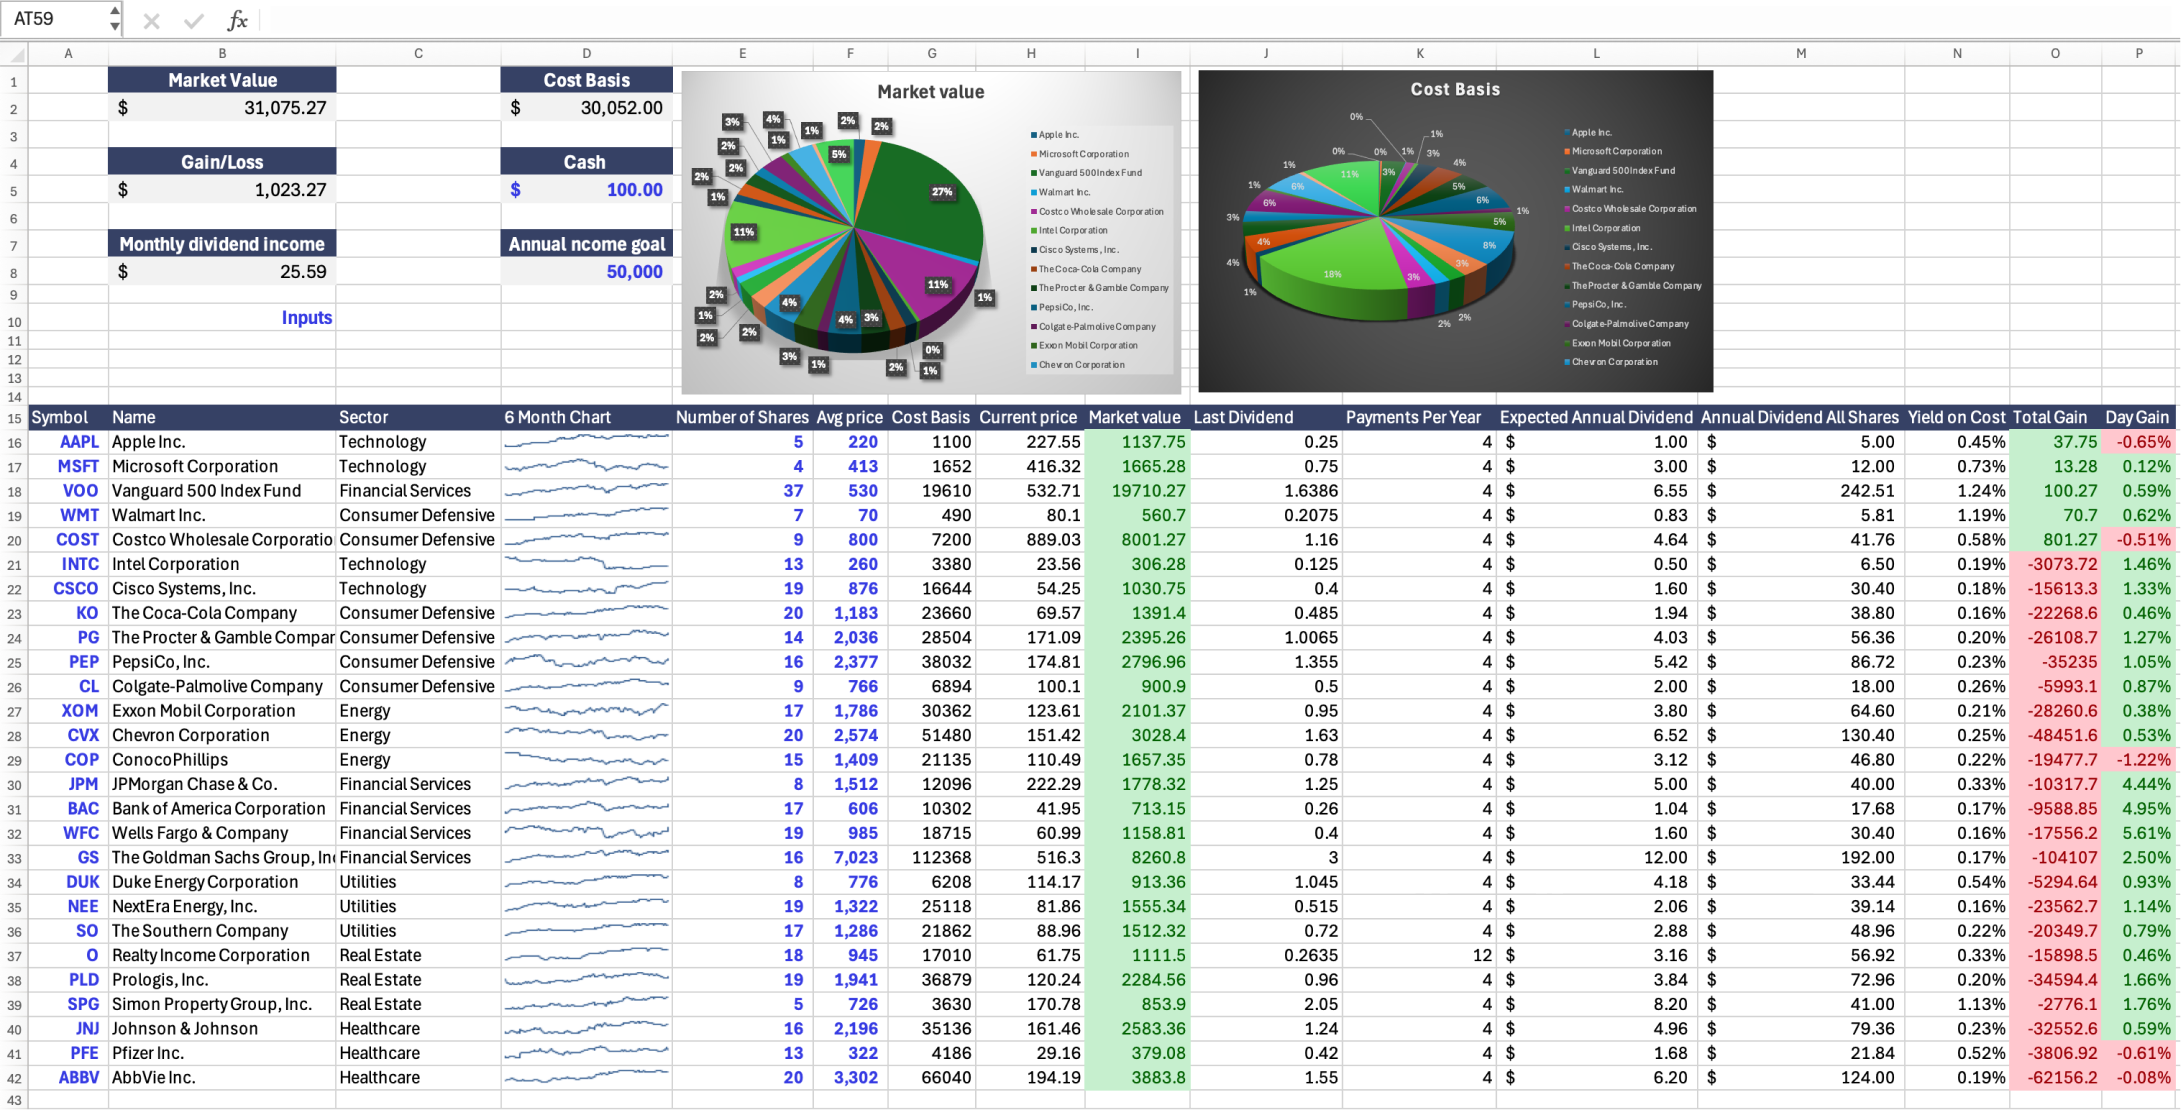
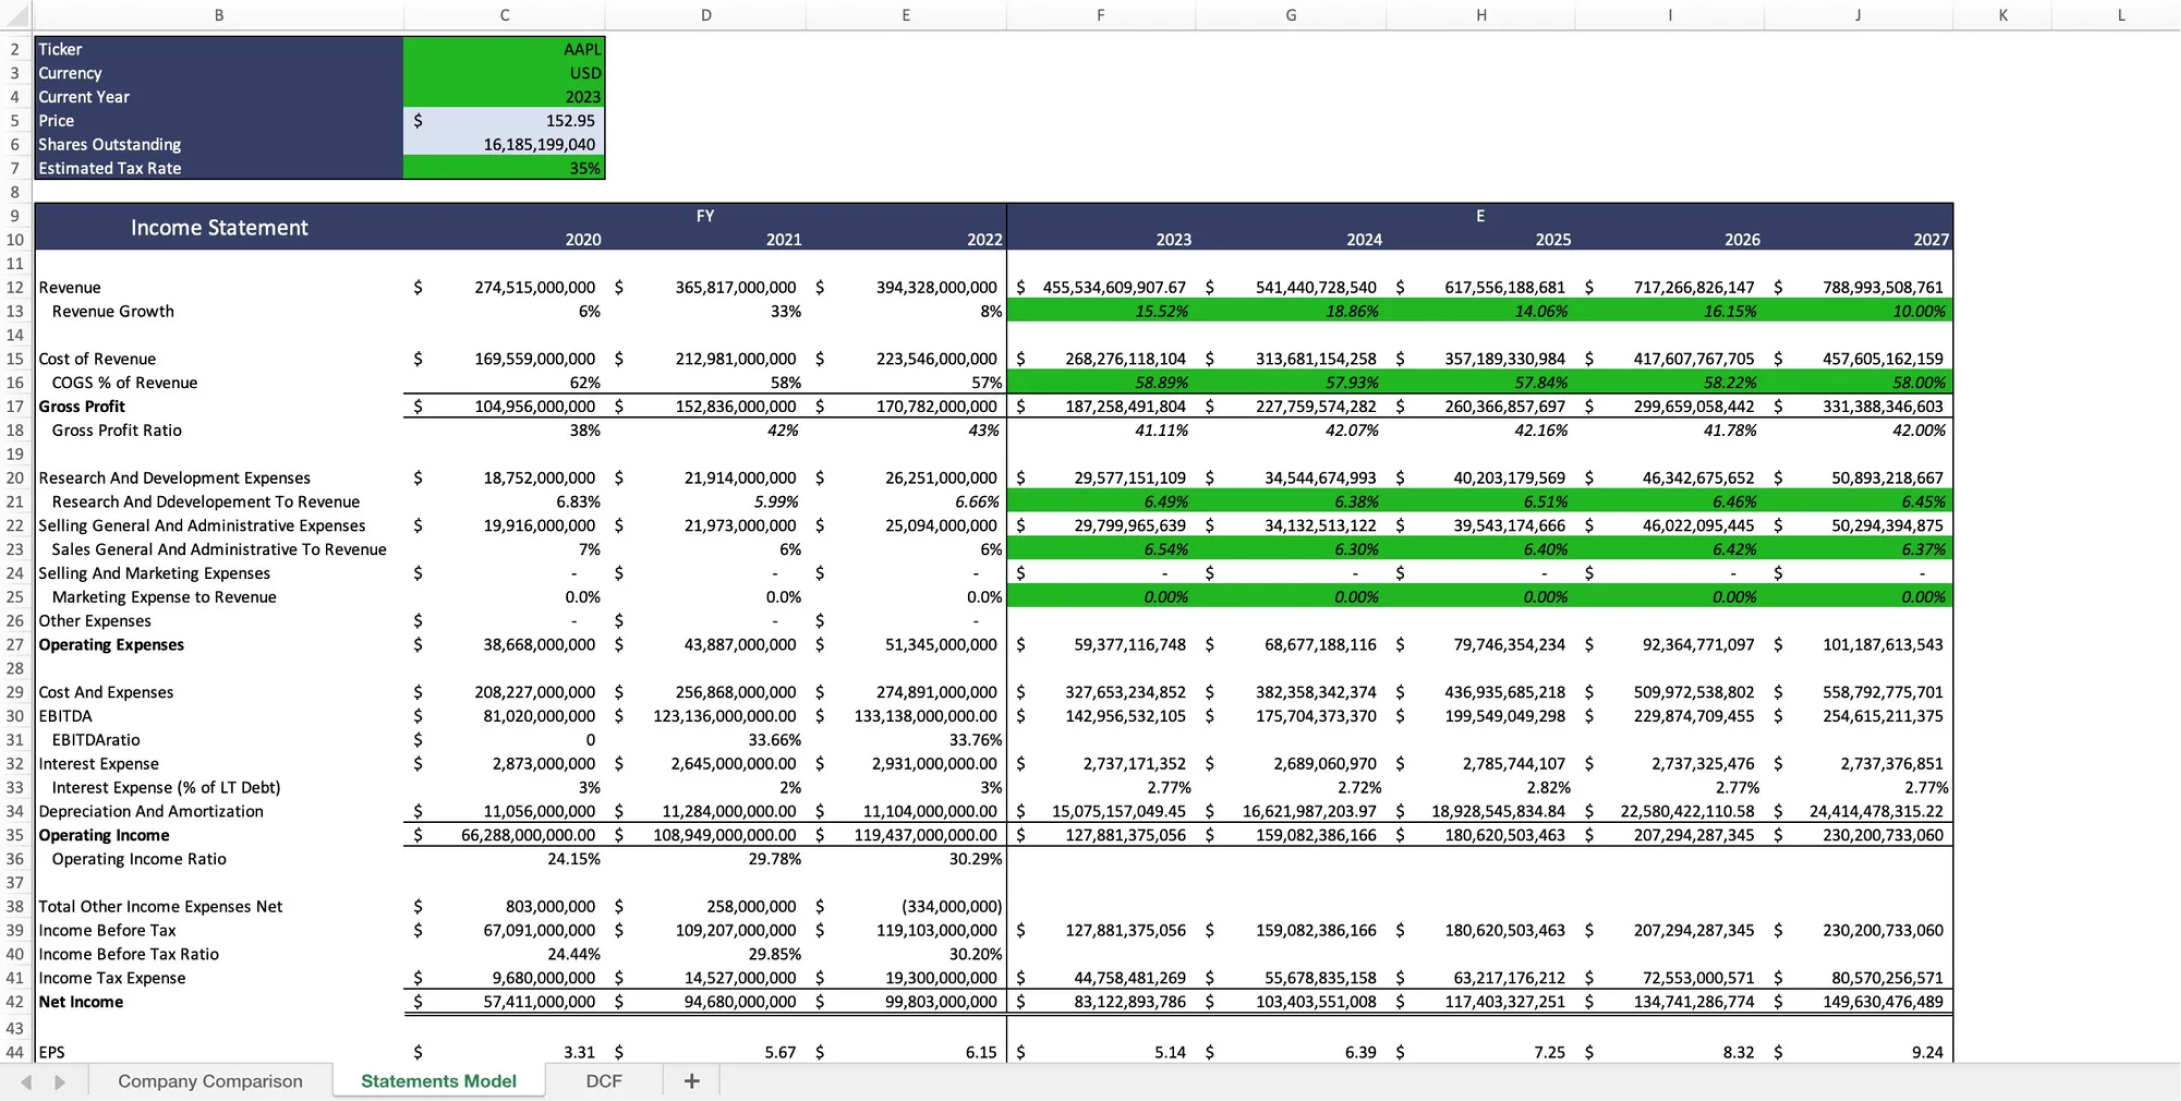
Tracking and finding valuable dividend stocks to invest in is difficult. For this, you can use Wisesheets, which allows you to pull all necessary dividend, financial, and price data to track your dividend investments in one place exactly how you want, using the power of spreadsheets.
Frequently asked questions❓
What is dividend history?
How do I check past dividend history?
What does the ex-dividend date mean?
What is JBOG.PA’s dividend yield?
What is the difference between regular and special dividends?
Has JBOG.PA increased its dividends over time?
Why might dividend history data be delayed?
How often does JBOG.PA pay dividends?
What factors impact JBOG.PA's dividend payments?
Can dividends change over time?
What is JBOG.PA’s next dividend date?

