British Land Company Plc
BLND.L
Price:
$357
Market Cap:
$3.57B
Our portfolio of high quality UK commercial property is focused on London Offices and Retail around the UK. We own or manage a portfolio valued at £13.7bn (British Land share: £10.3bn) as at 30 September 2020 making us one of Europe's largest listed real estate investment companies. Our strategy is to provide places which meet the needs of our customers and respond to changing lifestyles - Places People Prefer. We do this by creating great environments both inside and outside our buildings and use our scale and placemaking skills to enhance and enliven them. This expands their appeal to a broader range of occupiers, creating enduring demand and driving sustainable, long term performance. Our...[Read more]
Industry
REIT - Diversified
IPO Date
1988-07-01
Stock Exchange
LSE
Ticker
BLND.L
PE Ratio
[19.83]
ROE
[18.53%]
Current Ratio
[0.59]
Dividend Yield
[6.41%]
Enterprise Value
[5.82B]
Dividend History
BLND.L Dividend History Overview
Dividends are a key part of long-term returns for investors, and British Land Company Plc (BLND.L) has a track record worth reviewing. Looking at dividend history for BLND.L gives you an idea of how consistent the dividends have been and what you might expect in the future.
Ex-Dividend Date
2024-12-05
Dividend Yield
6.41%
Annual Dividend
$12.24
P/E Ratio
19.83
Payout Ratio
0.22
Dividend per Share
$0.23
EPS
0.18
| Ex-Date/EFF Date | Dividend Amount | Adjusted Dividend | Payment Date | Declaration Date |
|---|---|---|---|---|
| 2024-12-05 | $12.24 | $12.24 | 2025-01-15 | |
| 2024-06-20 | $10.64 | $10.64 | 2024-07-26 | |
| 2023-11-23 | $12.16 | $12.16 | 2024-01-05 | |
| 2023-06-22 | $11.04 | $11.04 | 2023-07-28 | |
| 2022-11-24 | $11.6 | $11.6 | 2023-01-06 | 2022-11-16 |
| 2022-06-23 | $11.6 | $11.6 | 2022-07-29 | 2022-05-18 |
| 2021-11-25 | $10.32 | $10.32 | 2022-01-07 | 2021-11-17 |
| 2021-06-24 | $6.64 | $6.64 | 2021-08-06 | 2021-05-26 |
| 2021-01-07 | $8.4 | $8.4 | 2021-02-19 | 2020-11-18 |
| 2020-03-26 | $7.9825 | $7.9825 | 2020-05-01 | 2020-01-28 |
| 2020-01-02 | $7.9825 | $7.9825 | 2020-02-07 | 2019-11-13 |
British Land Company Plc (BLND.L) Dividend History Chart
The table below shows British Land Company Plc (BLND.L) dividend history over the years, including the amount per share, the payout date, and any adjustments for stock splits.
British Land Company Plc (BLND.L) Dividend Growth
British Land Company Plc (BLND.L) dividend history also allows you to track its dividend growth over time. This gives you insight into how the company’s earnings and payout ratios have evolved. Tracking this growth can help you gauge the stock's potential for future income.
Other Popular Dividend Stocks
Check out the dividend history of other popular stocks:
| Stock name | Dividend yield |
|---|---|
| Land Securities Group plc (LAND.L) | 0.07% |
| Hammerson plc (HMSO.L) | 0.01% |
| Associated British Foods plc (ABF.L) | 0.02% |
| SEGRO Plc (SGRO.L) | 0.04% |
| Compass Group PLC (CPG.L) | 0.02% |
Track & Identify Dividend Stocks
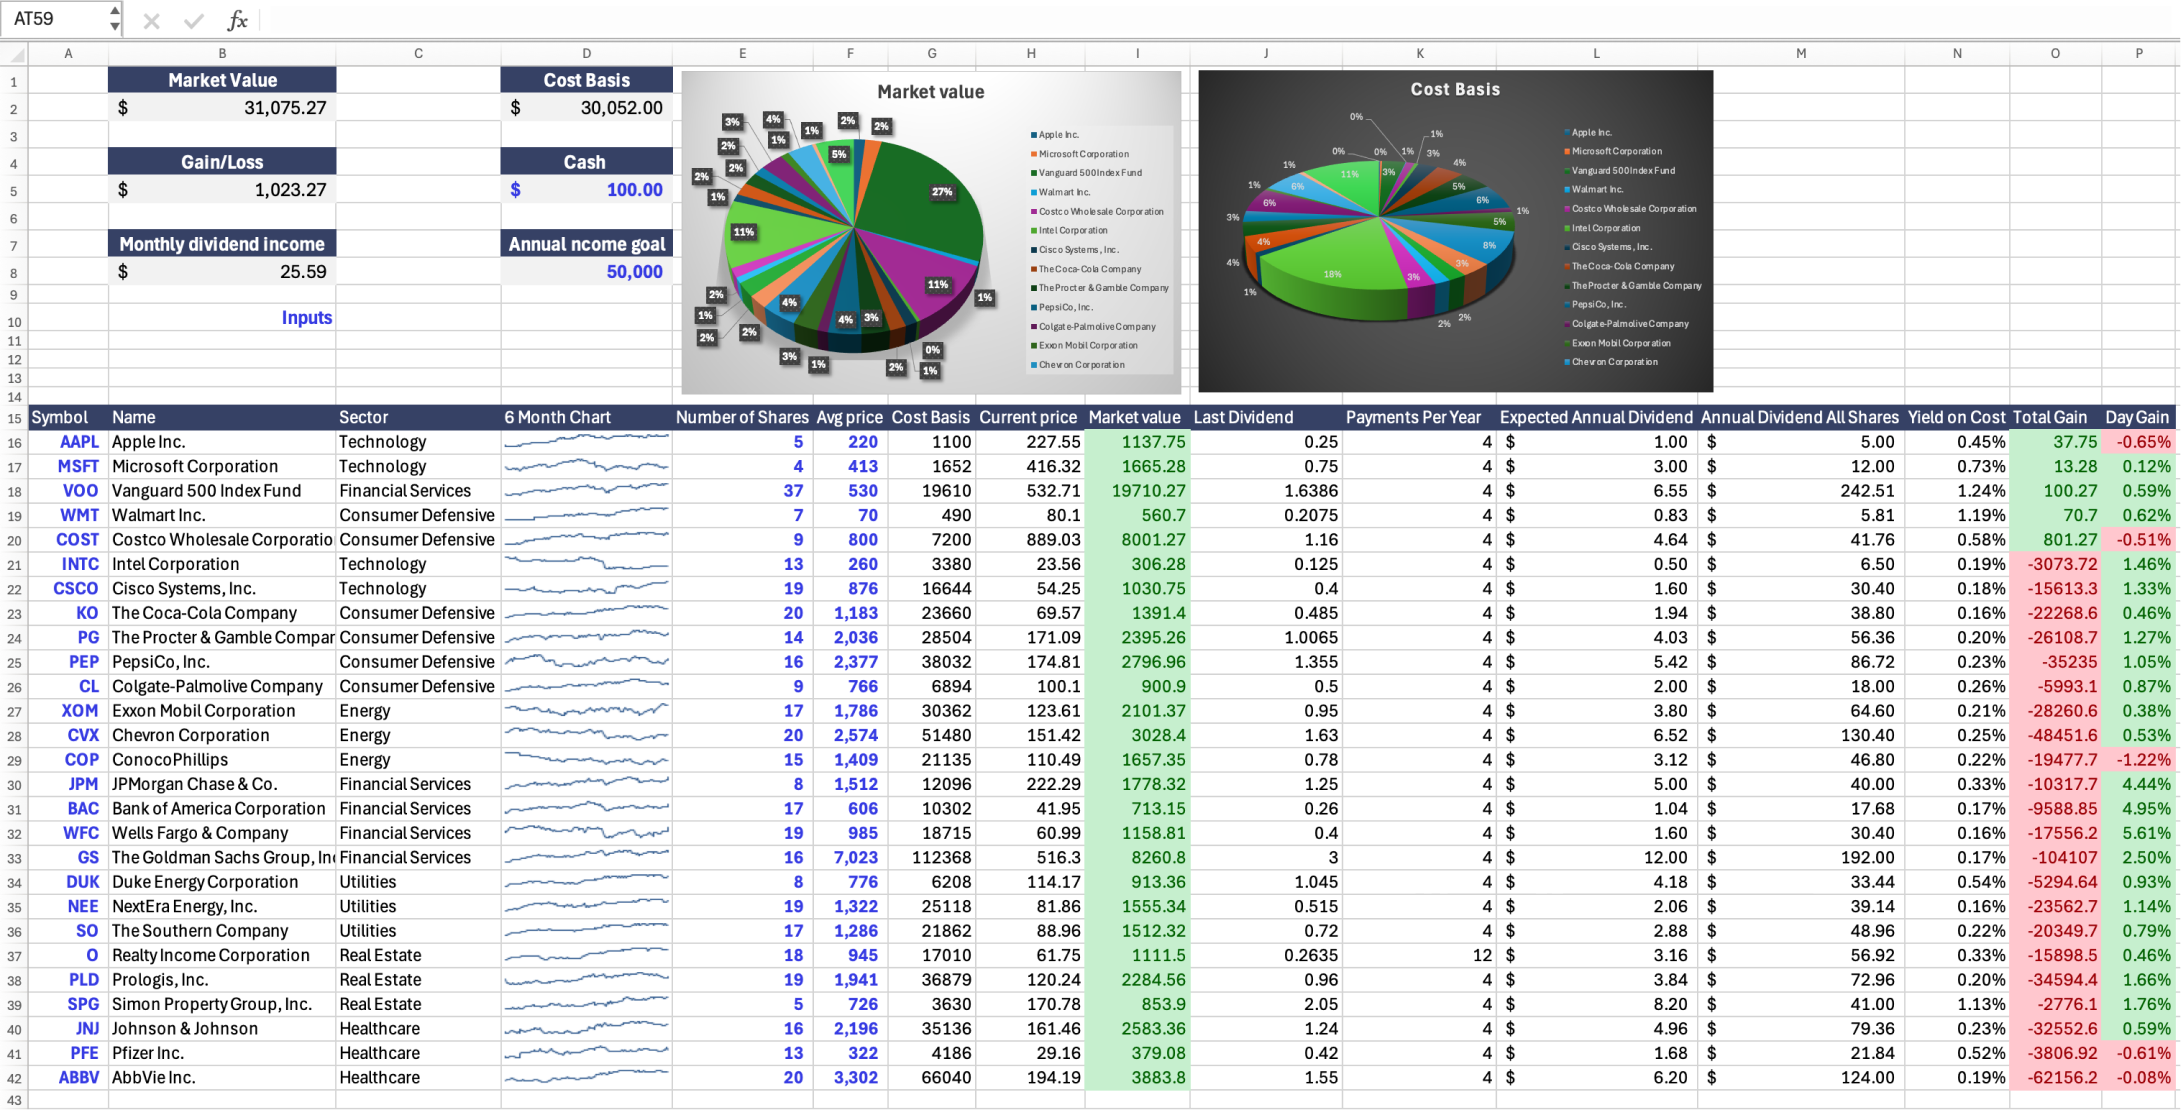
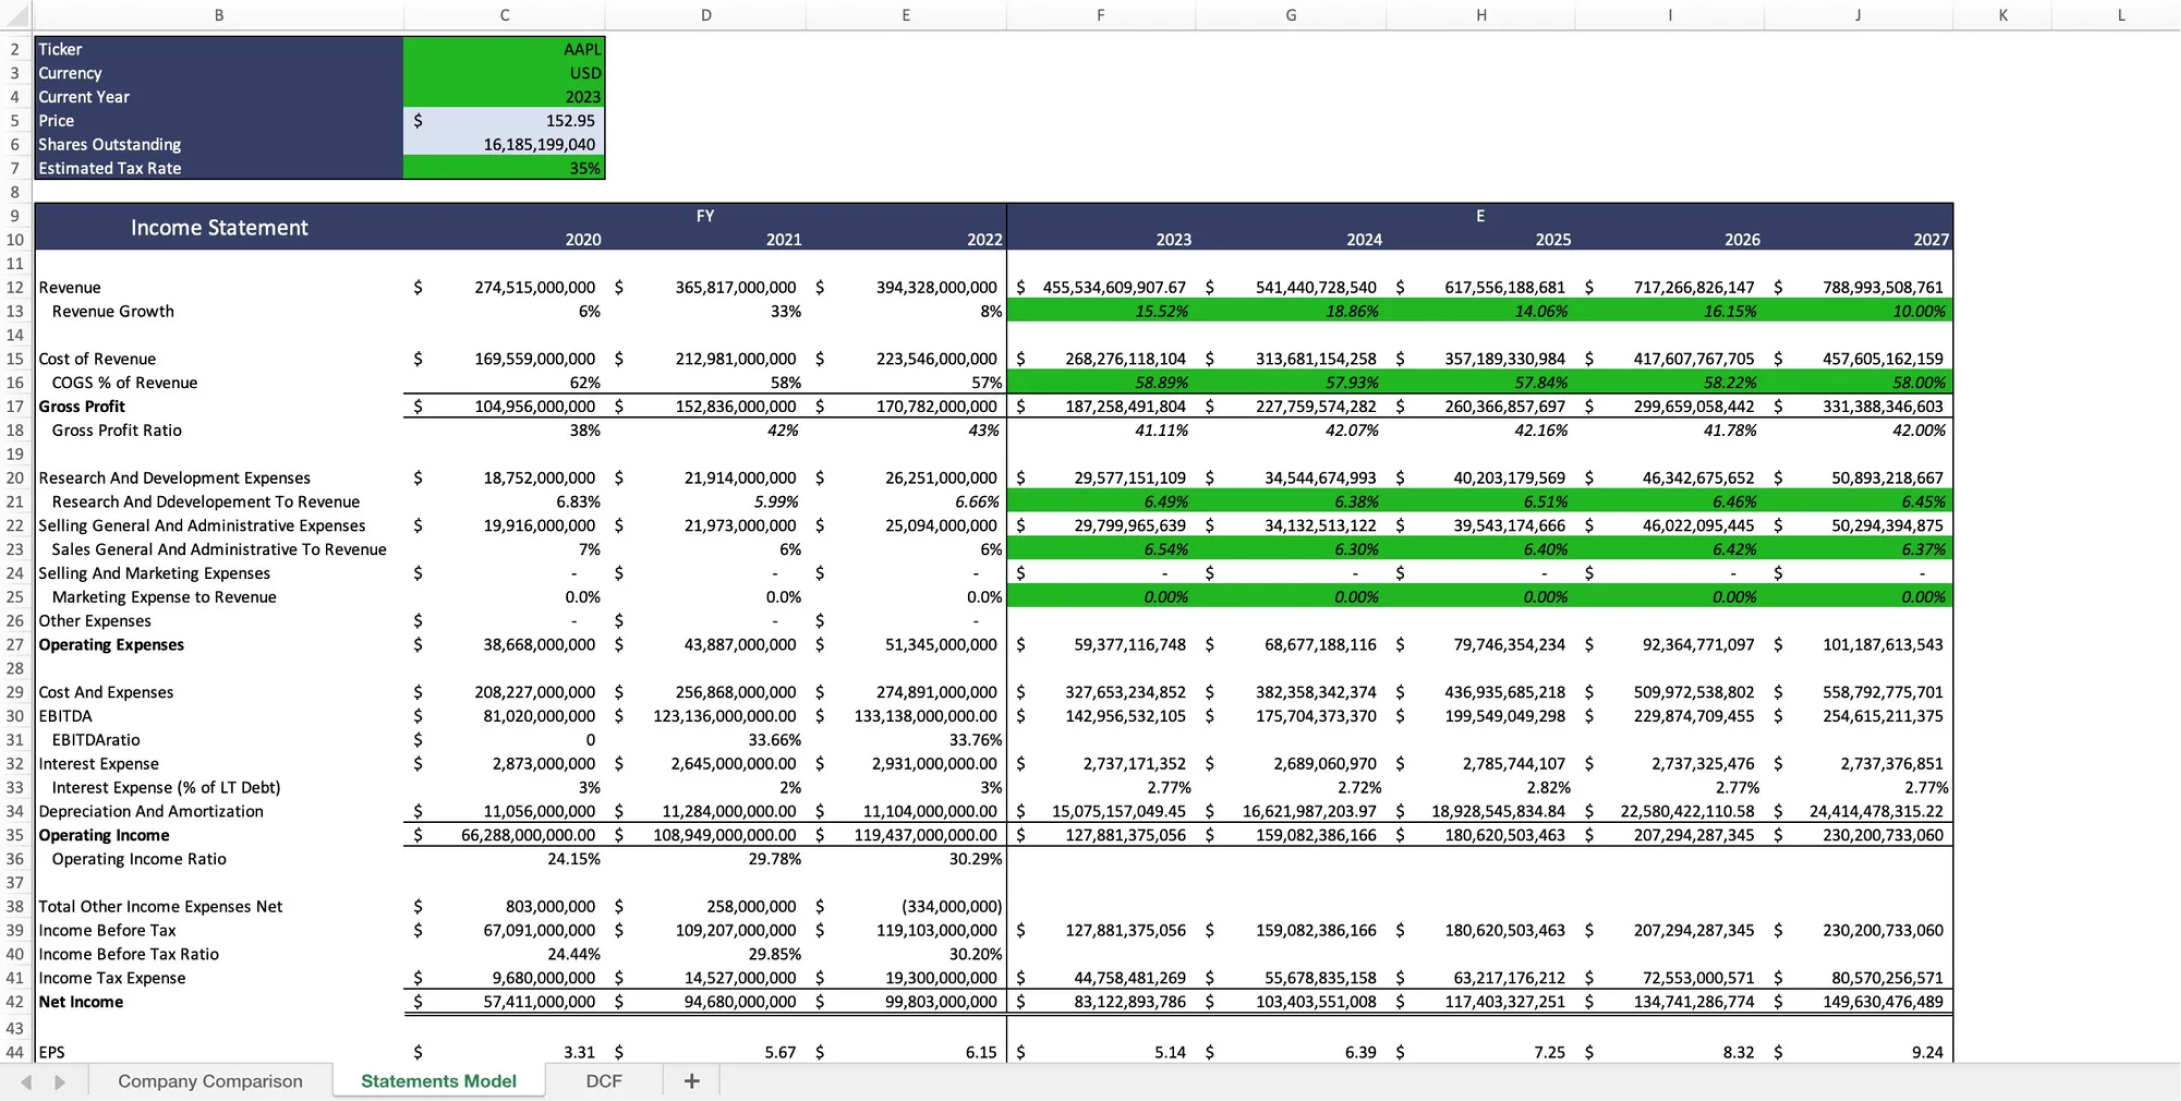
Tracking and finding valuable dividend stocks to invest in is difficult. For this, you can use Wisesheets, which allows you to pull all necessary dividend, financial, and price data to track your dividend investments in one place exactly how you want, using the power of spreadsheets.
You can build any custom analysis dashboards, screeners and trackers with no code and analyze companies like British Land Company Plc (BLND.L) without the pain and hassle of copy pasting data.
Frequently asked questions❓
What is dividend history?
How do I check past dividend history?
What does the ex-dividend date mean?
What is BLND.L’s dividend yield?
What is the difference between regular and special dividends?
Has BLND.L increased its dividends over time?
Why might dividend history data be delayed?
How often does BLND.L pay dividends?
What factors impact BLND.L's dividend payments?
Can dividends change over time?
What is BLND.L’s next dividend date?

