B&G Foods, Inc.
BGS
Price:
$7.1
Market Cap:
$562.06M
B&G Foods, Inc. manufactures, sells, and distributes a portfolio of shelf-stable and frozen foods, and household products in the United States, Canada, and Puerto Rico. The company's products include frozen and canned vegetables, vegetables, canola and other cooking oils, vegetable shortening, cooking sprays, oatmeal and other hot cereals, fruit spreads, canned meats and beans, bagel chips, spices, seasonings, hot sauces, wine vinegar, maple syrups, molasses, salad dressings, pizza crusts, Mexican-style sauces, dry soups, taco shells and kits, salsas, pickles, peppers, tomato-based products, baking powder and soda, corn starch, cookies and crackers, nut clusters, and other specialty products...[Read more]
Industry
Packaged Foods
IPO Date
2007-05-23
Stock Exchange
NYSE
Ticker
BGS
PE Ratio
[-22.19]
ROE
[-3.35%]
Current Ratio
[1.64]
Dividend Yield
[10.70%]
Enterprise Value
[2.65B]
Dividend History
BGS Dividend History Overview
Dividends are a key part of long-term returns for investors, and B&G Foods, Inc. (BGS) has a track record worth reviewing. Looking at dividend history for BGS gives you an idea of how consistent the dividends have been and what you might expect in the future.
Ex-Dividend Date
2024-12-31
Dividend Yield
10.70%
Annual Dividend
$0.19
P/E Ratio
-22.19
Payout Ratio
-2.28
Dividend per Share
$0.76
EPS
-0.32
| Ex-Date/EFF Date | Dividend Amount | Adjusted Dividend | Payment Date | Declaration Date |
|---|---|---|---|---|
| 2024-12-31 | $0.19 | $0.19 | 2025-01-30 | 2024-10-29 |
| 2024-09-30 | $0.19 | $0.19 | 2024-10-30 | 2024-07-30 |
| 2024-06-28 | $0.19 | $0.19 | 2024-07-30 | 2024-05-21 |
| 2024-03-27 | $0.19 | $0.19 | 2024-04-30 | 2024-02-26 |
| 2023-12-28 | $0.19 | $0.19 | 2024-01-30 | 2023-11-13 |
| 2023-09-28 | $0.19 | $0.19 | 2023-10-30 | 2023-08-01 |
| 2023-06-29 | $0.19 | $0.19 | 2023-07-31 | 2023-05-16 |
| 2023-03-30 | $0.19 | $0.19 | 2023-05-01 | 2023-02-27 |
| 2022-12-29 | $0.19 | $0.19 | 2023-01-30 | 2022-11-09 |
| 2022-09-29 | $0.475 | $0.475 | 2022-10-31 | 2022-08-01 |
| 2022-06-29 | $0.475 | $0.475 | 2022-08-01 | 2022-05-17 |
B&G Foods, Inc. (BGS) Dividend History Chart
The table below shows B&G Foods, Inc. (BGS) dividend history over the years, including the amount per share, the payout date, and any adjustments for stock splits.
B&G Foods, Inc. (BGS) Dividend Growth
B&G Foods, Inc. (BGS) dividend history also allows you to track its dividend growth over time. This gives you insight into how the company’s earnings and payout ratios have evolved. Tracking this growth can help you gauge the stock's potential for future income.
Other Popular Dividend Stocks
Check out the dividend history of other popular stocks:
| Stock name | Dividend yield |
|---|---|
| Campbell Soup Company (CPB) | 0.04% |
| General Mills, Inc. (GIS) | 0.04% |
| Hormel Foods Corporation (HRL) | 0.04% |
| Kellogg Company (K) | 0.03% |
| Lamb Weston Holdings, Inc. (LW) | 0.02% |
| Conagra Brands, Inc. (CAG) | 0.05% |
| The J. M. Smucker Company (SJM) | 0.04% |
| McCormick & Company, Incorporated (MKC) | 0.02% |
| J&J Snack Foods Corp. (JJSF) | 0.02% |
| The Kraft Heinz Company (KHC) | 0.05% |
Track & Identify Dividend Stocks
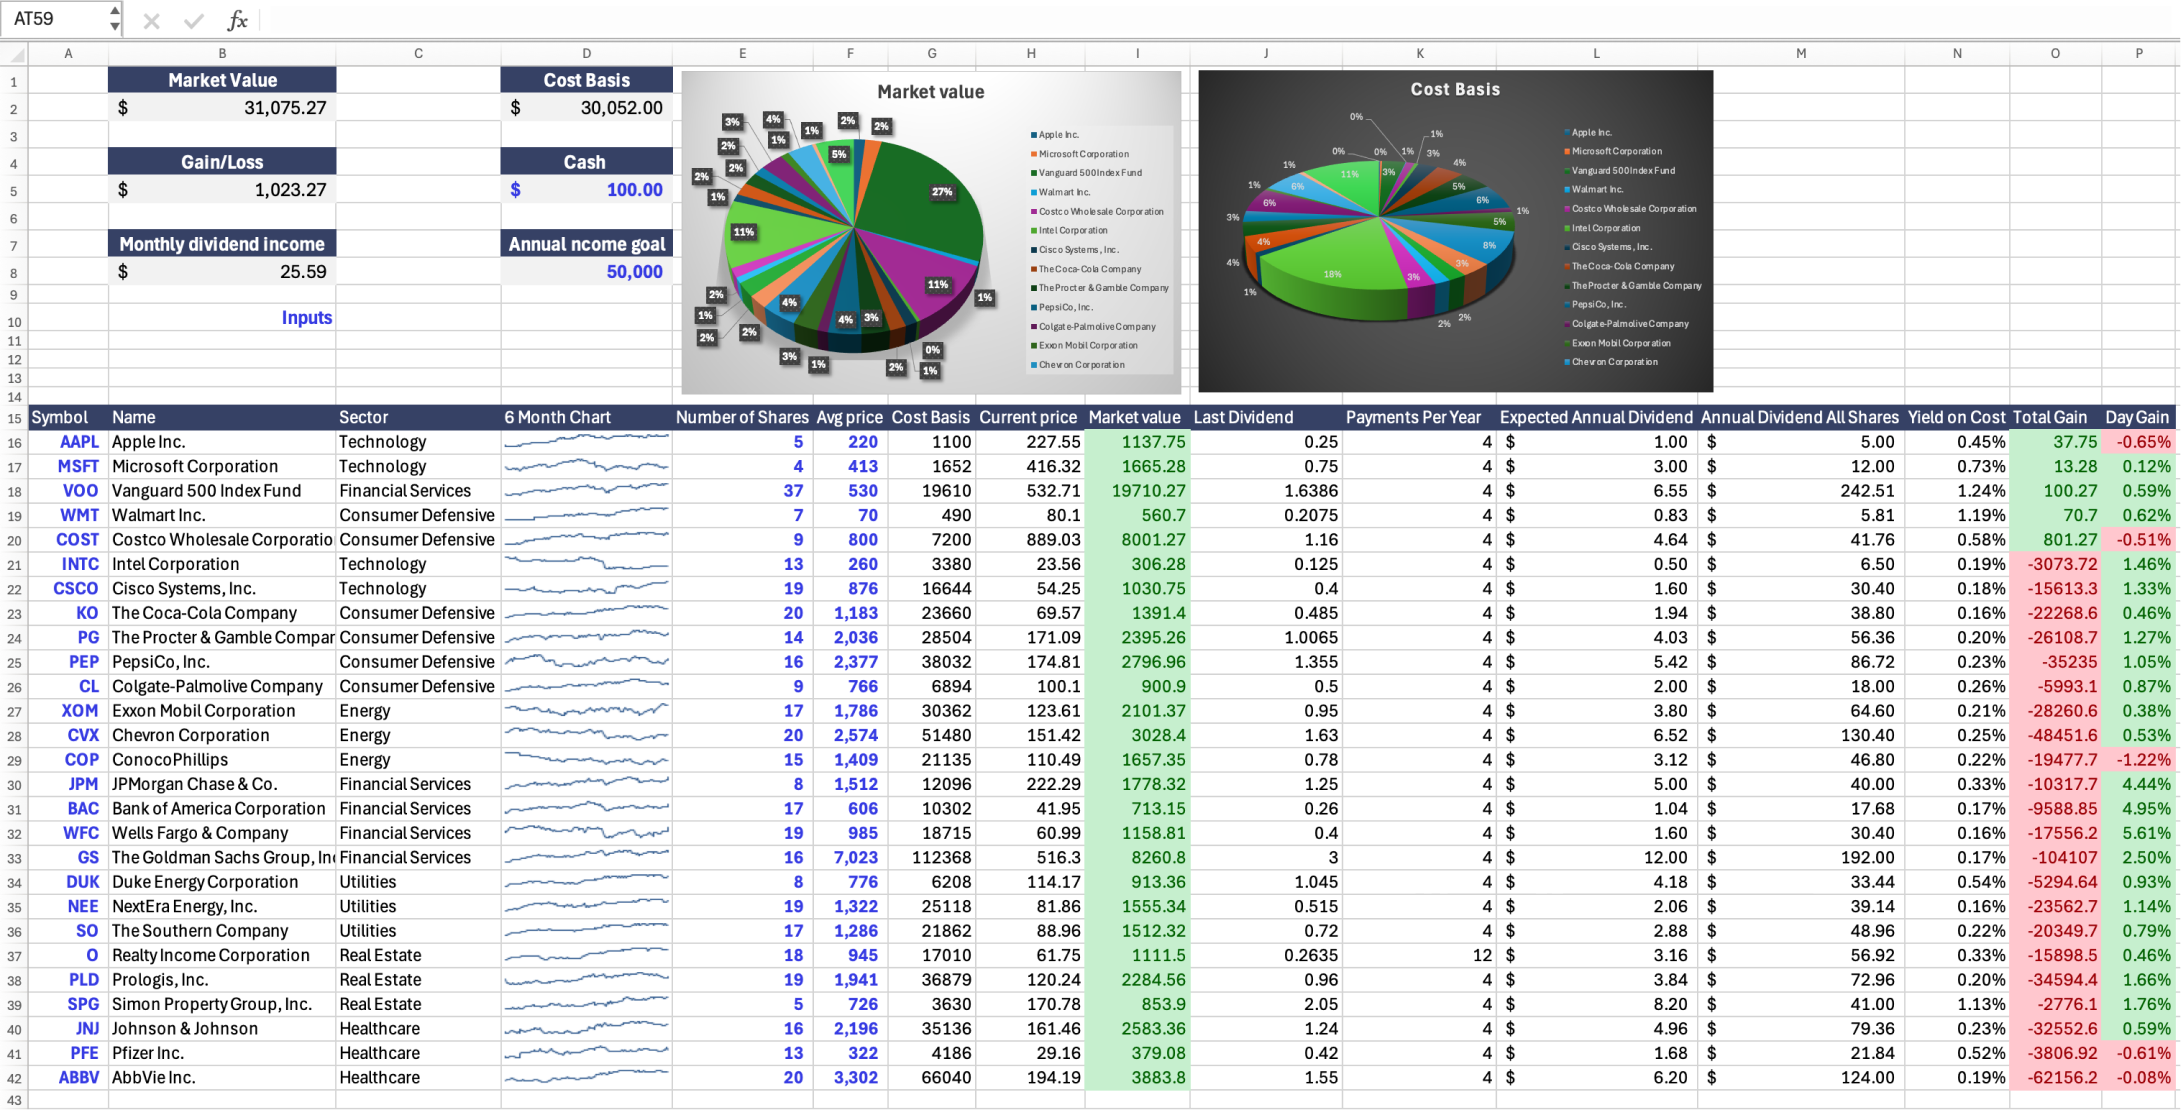
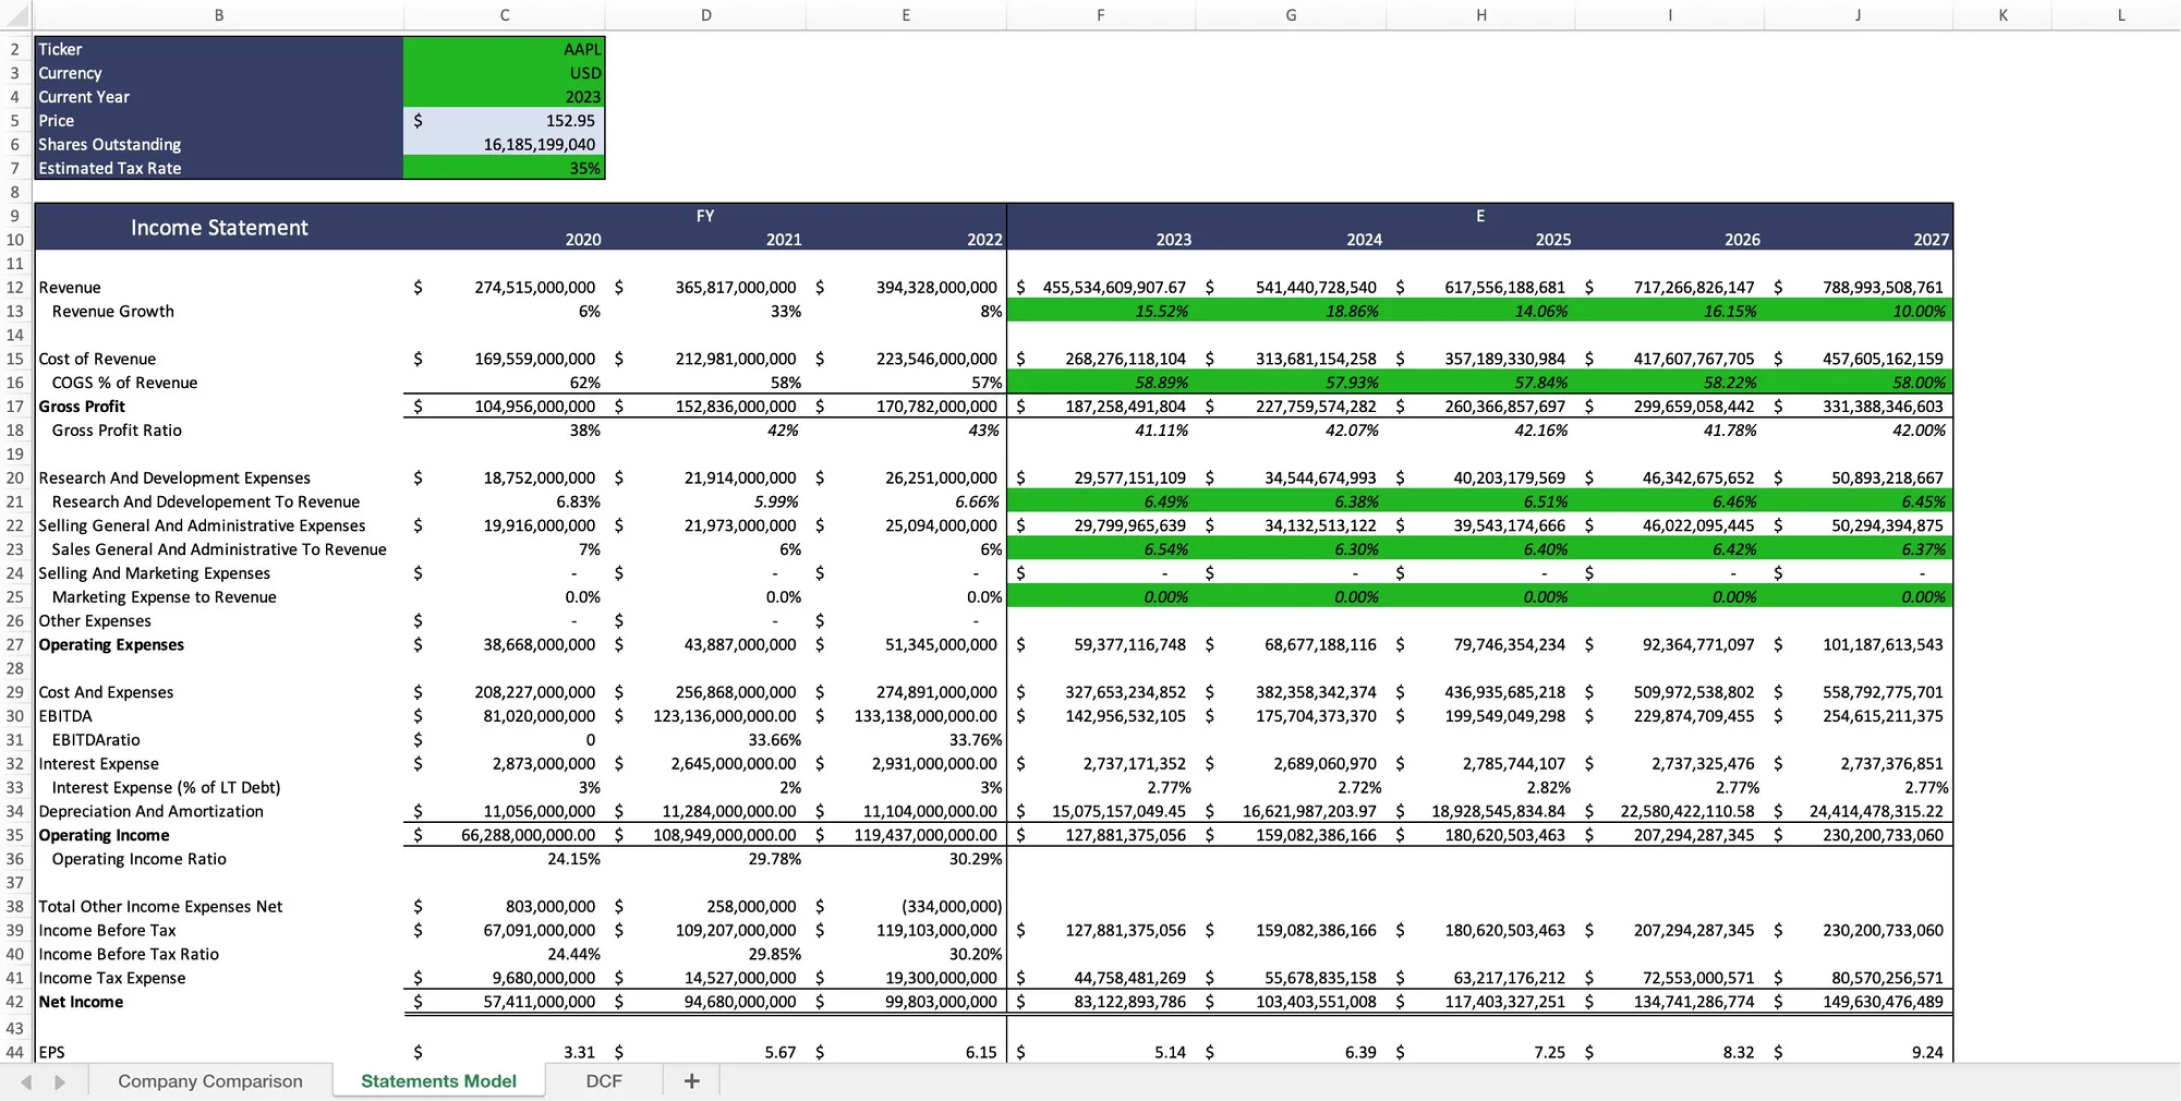
Tracking and finding valuable dividend stocks to invest in is difficult. For this, you can use Wisesheets, which allows you to pull all necessary dividend, financial, and price data to track your dividend investments in one place exactly how you want, using the power of spreadsheets.
You can build any custom analysis dashboards, screeners and trackers with no code and analyze companies like B&G Foods, Inc. (BGS) without the pain and hassle of copy pasting data.
Frequently asked questions❓
What is dividend history?
How do I check past dividend history?
What does the ex-dividend date mean?
What is BGS’s dividend yield?
What is the difference between regular and special dividends?
Has BGS increased its dividends over time?
Why might dividend history data be delayed?
How often does BGS pay dividends?
What factors impact BGS's dividend payments?
Can dividends change over time?
What is BGS’s next dividend date?

