ASML Holding N.V.
ASMLF
Price:
$717
Market Cap:
$270.87B
ASML Holding N.V. develops, produces, markets, sells, and services advanced semiconductor equipment systems consisting of lithography, metrology, and inspection related systems for memory and logic chipmakers. The company provides extreme ultraviolet lithography systems; and deep ultraviolet lithography systems comprising immersion and dry lithography solutions to manufacture various range of semiconductor nodes and technologies. It also offers metrology and inspection systems, including YieldStar optical metrology solutions to measure the quality of patterns on the wafers; and HMI e-beam solutions to locate and analyze individual chip defects. In addition, the company provides computational...[Read more]
Industry
Semiconductors
IPO Date
2013-03-18
Stock Exchange
PNK
Ticker
ASMLF
PE Ratio
[39.16]
ROE
[47.68%]
Current Ratio
[1.55]
Dividend Yield
[0.91%]
Enterprise Value
[270.58B]
Dividend History
ASMLF Dividend History Overview
Dividends are a key part of long-term returns for investors, and ASML Holding N.V. (ASMLF) has a track record worth reviewing. Looking at dividend history for ASMLF gives you an idea of how consistent the dividends have been and what you might expect in the future.
Ex-Dividend Date
2024-10-29
Dividend Yield
0.91%
Annual Dividend
$1.64
P/E Ratio
39.16
Payout Ratio
0.35
Dividend per Share
$6.24
EPS
18.31
| Ex-Date/EFF Date | Dividend Amount | Adjusted Dividend | Payment Date | Declaration Date |
|---|---|---|---|---|
| 2024-10-29 | $1.6439 | $1.6439 | 2024-11-07 | |
| 2024-07-29 | $1.64511 | $1.64511 | 2024-08-07 | |
| 2024-04-26 | $1.878 | $1.878 | 2024-05-07 | |
| 2024-02-05 | $1.565 | $1.565 | 2024-02-14 | |
| 2023-11-01 | $1.534 | $1.534 | 2023-11-10 | |
| 2023-08-01 | $1.595 | $1.595 | 2023-08-10 | |
| 2023-04-28 | $1.864 | $1.864 | 2023-05-10 | |
| 2023-02-06 | $1.479 | $1.479 | 2023-02-15 | |
| 2022-11-03 | $1.345 | $1.345 | 2022-11-14 | |
| 2022-08-04 | $1.394 | $1.394 | 2022-08-12 | |
| 2022-05-03 | $3.888 | $3.888 | 2022-05-12 |
ASML Holding N.V. (ASMLF) Dividend History Chart
The table below shows ASML Holding N.V. (ASMLF) dividend history over the years, including the amount per share, the payout date, and any adjustments for stock splits.
ASML Holding N.V. (ASMLF) Dividend Growth
ASML Holding N.V. (ASMLF) dividend history also allows you to track its dividend growth over time. This gives you insight into how the company’s earnings and payout ratios have evolved. Tracking this growth can help you gauge the stock's potential for future income.
Other Popular Dividend Stocks
Check out the dividend history of other popular stocks:
| Stock name | Dividend yield |
|---|---|
| Sumco Corporation (SUOPY) | 0.02% |
| Disco Corporation (DSCSY) | 0.01% |
| SCREEN Holdings Co., Ltd. (DINRF) | 0.03% |
| BE Semiconductor Industries N.V. (AIXXF) | 0.03% |
| Lasertec Corporation (BESIY) | 0.02% |
| Tokyo Electron Limited (LSRCY) | 0.01% |
| ASMPT Limited (TOELY) | 0.02% |
| Advantest Corporation (ASMVY) | 0.01% |
| Advantest Corporation (ATEYY) | 0.00% |
| Teradyne, Inc. (ADTTF) | 0.00% |
| Ambarella, Inc. (TER) | 0.00% |
| Applied Materials, Inc. (LRCX) | 0.01% |
| ASML Holding N.V. (AMAT) | 0.01% |
| Lasertec Corporation (ASML) | 0.01% |
| (LSRCF) | 0.01% |
Track & Identify Dividend Stocks
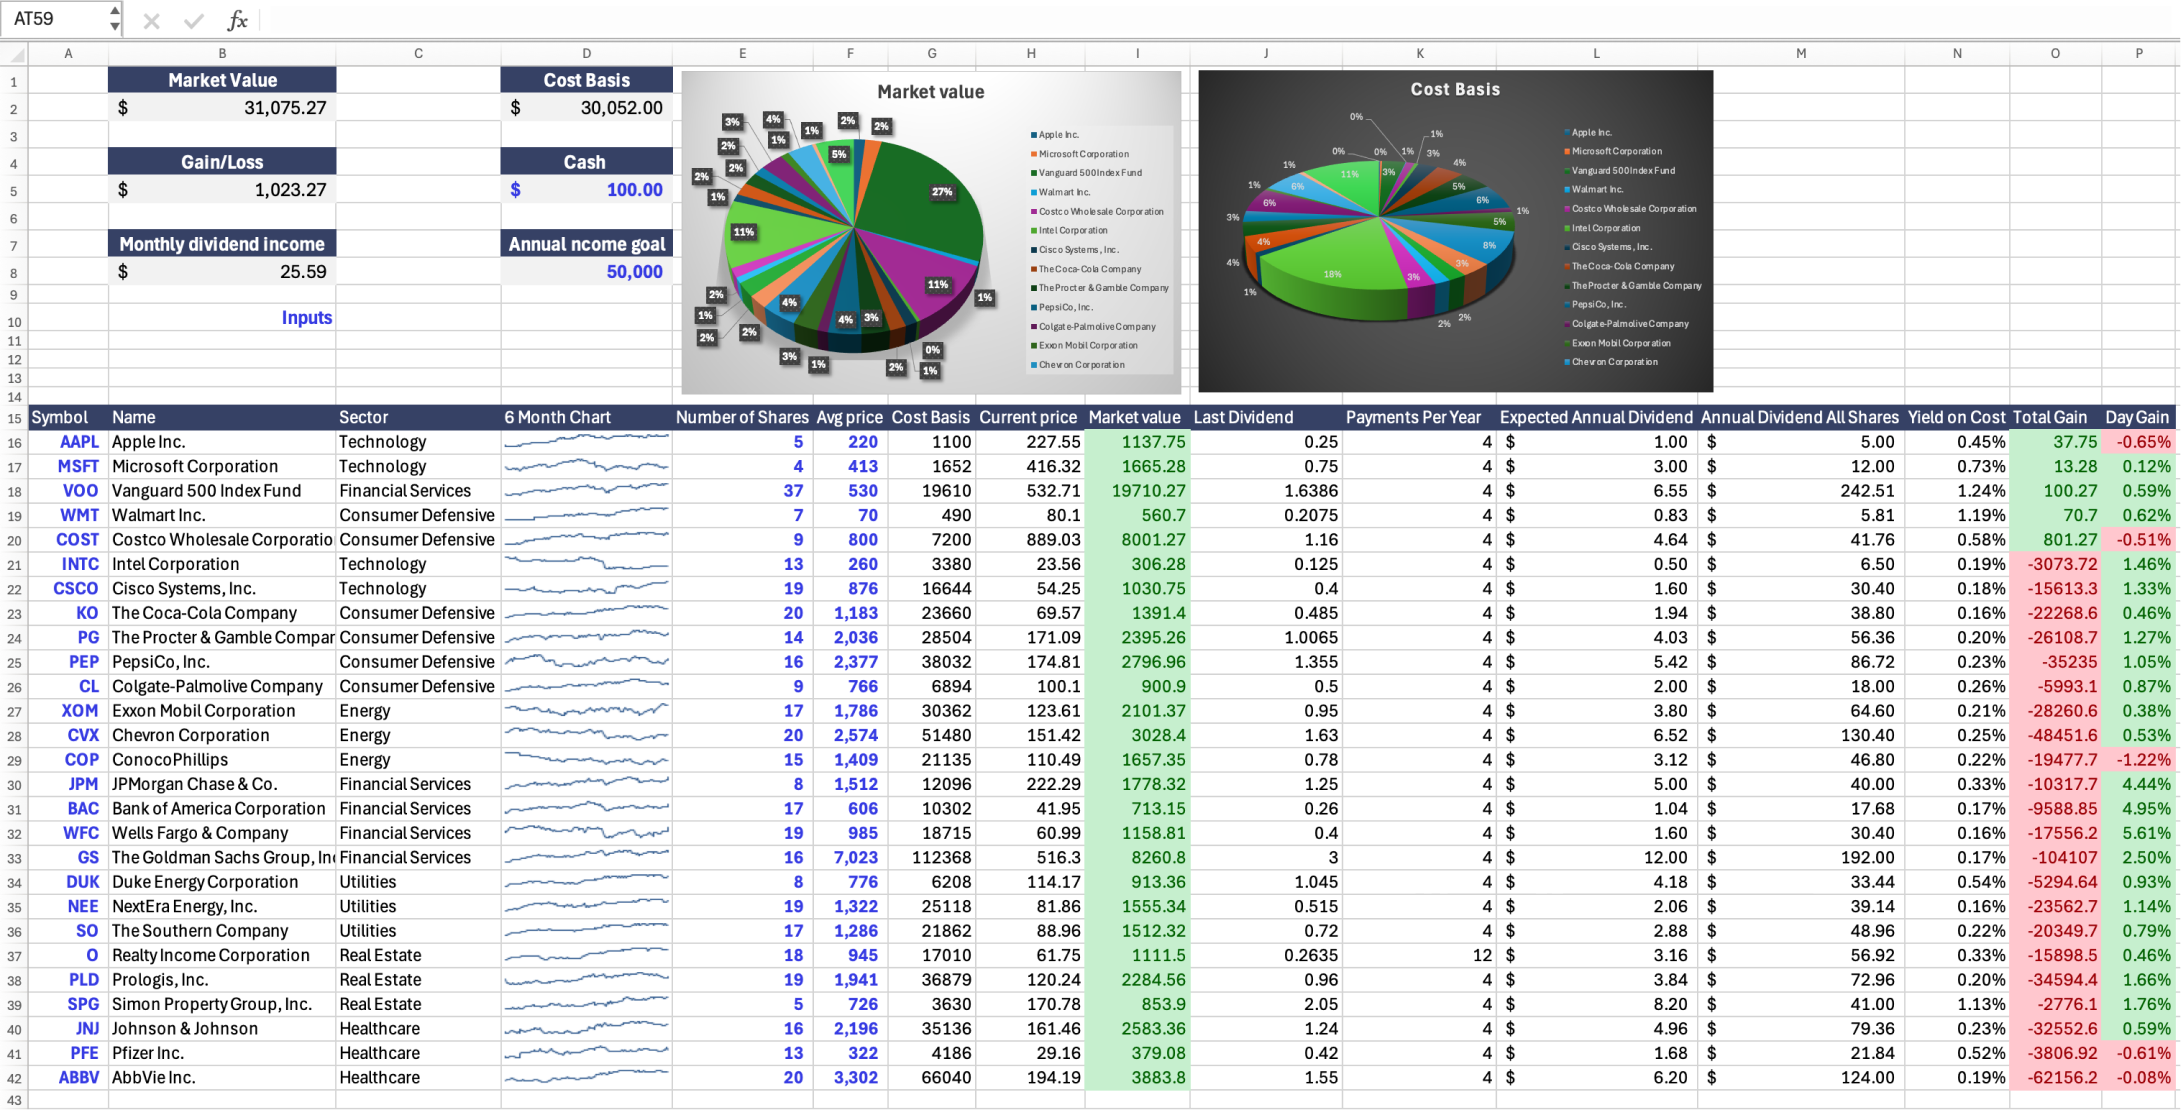
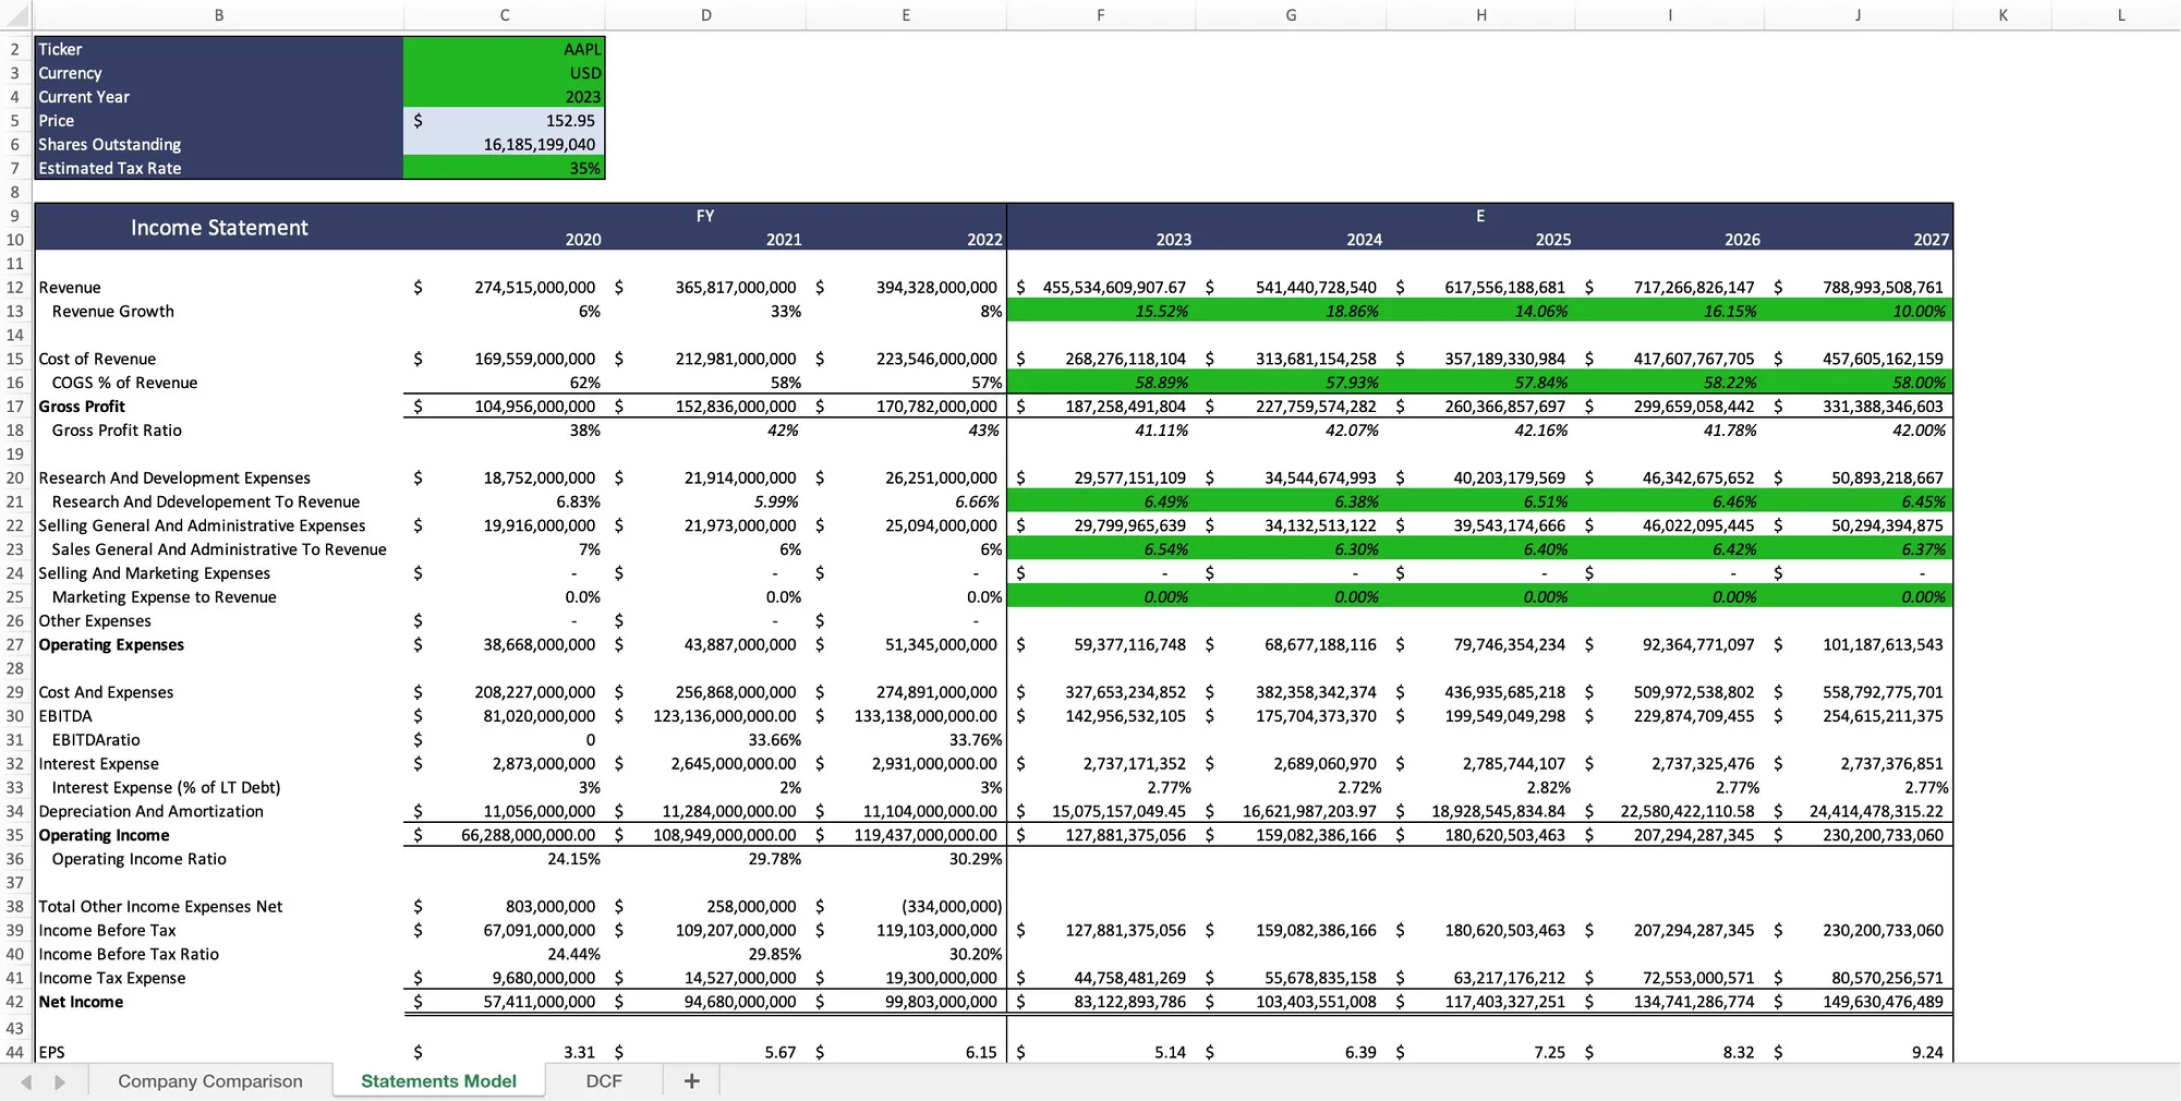
Tracking and finding valuable dividend stocks to invest in is difficult. For this, you can use Wisesheets, which allows you to pull all necessary dividend, financial, and price data to track your dividend investments in one place exactly how you want, using the power of spreadsheets.
You can build any custom analysis dashboards, screeners and trackers with no code and analyze companies like ASML Holding N.V. (ASMLF) without the pain and hassle of copy pasting data.
Frequently asked questions❓
What is dividend history?
How do I check past dividend history?
What does the ex-dividend date mean?
What is ASMLF’s dividend yield?
What is the difference between regular and special dividends?
Has ASMLF increased its dividends over time?
Why might dividend history data be delayed?
How often does ASMLF pay dividends?
What factors impact ASMLF's dividend payments?
Can dividends change over time?
What is ASMLF’s next dividend date?

