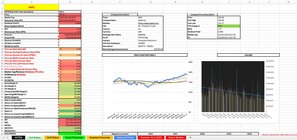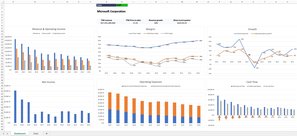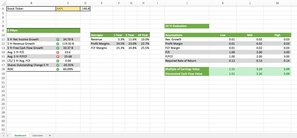
Unveil the essence of a company's financial journey without the distractions of charts. The Financial Snapshot Template offers a comprehensive array of valuation metrics, financial data, and historical calculations. Empower your financial analysis with precision and depth.
Introduction
A clear, uncluttered view of a company's financial health is often the key to astute investment decisions. Introducing the Financial Snapshot Template, meticulously crafted for those who prioritize raw data and numbers over visuals. Dive deep into historical financials, valuation metrics, and insightful calculations to truly understand a company's fiscal journey.
Why the Financial Snapshot Template is a Game-Changer
- Data-Driven Focus: Experience financial analysis without the potential biases of charts.
- In-Depth Valuation Metrics: From P/E ratios to intrinsic value calculations, delve into what truly matters.
- Historical Financials: Trace back a company's financial history for a comprehensive view.
- Automated Calculations: Simply input the necessary data and let the template handle complex computations.
- User-Friendly Interface: Organized for ease and clarity, ensuring swift navigation through vast financial data.
Signature Features
- Detailed Valuation Metrics: Explore a plethora of metrics to gauge a company's worth accurately.
- Year-on-Year Financials: Review annual financial data to discern patterns and trends.
- Automated Financial Ratios: Instantly compute critical ratios like Debt-to-Equity, Current Ratio, and Return on Equity.
- Historical Performance Indicators: Calculate and compare key performance metrics over the years.
Ideal For
- Equity Research Analysts: Get an unfiltered view of a company's financial standing.
- Value Investors: Dive deep into valuation metrics for well-informed investment decisions.
- Financial Consultants: Offer clients a clear picture of company financials without visual distractions.
- Academics & Students: Study and understand the raw financial data of businesses.
User Feedback
"The Financial Snapshot Template is a breath of fresh air. It's all about the numbers, and that's exactly what I needed." - Jonathan M.
"From valuation metrics to historical financials, this template has streamlined my research process. Absolute gold!" - Fatima Z.
FAQs
Q: Can I customize the template to include additional metrics or financial data?
A: Yes, the Financial Snapshot Template is designed for flexibility, allowing you to add or modify metrics as needed.
Q: How far back can I trace the historical financials?
A: The template supports multi-year data input, enabling comprehensive historical analysis.
Other powerful templates

Complete Quantitative Analysis
Complete quantitative analysis with historical data, ratios etc...

Hypercharts Stock Graphs
Visualize stock fundamentals and key metrics in one single view.

Everything Money Stock Analyzer
This is "Everything money" 8 pillar + Stock analyzer tool.
